
This blog serves as your guide in creating a lakehouse, importing sample data into the delta table, implementing necessary transformations, and ultimately generating reports.
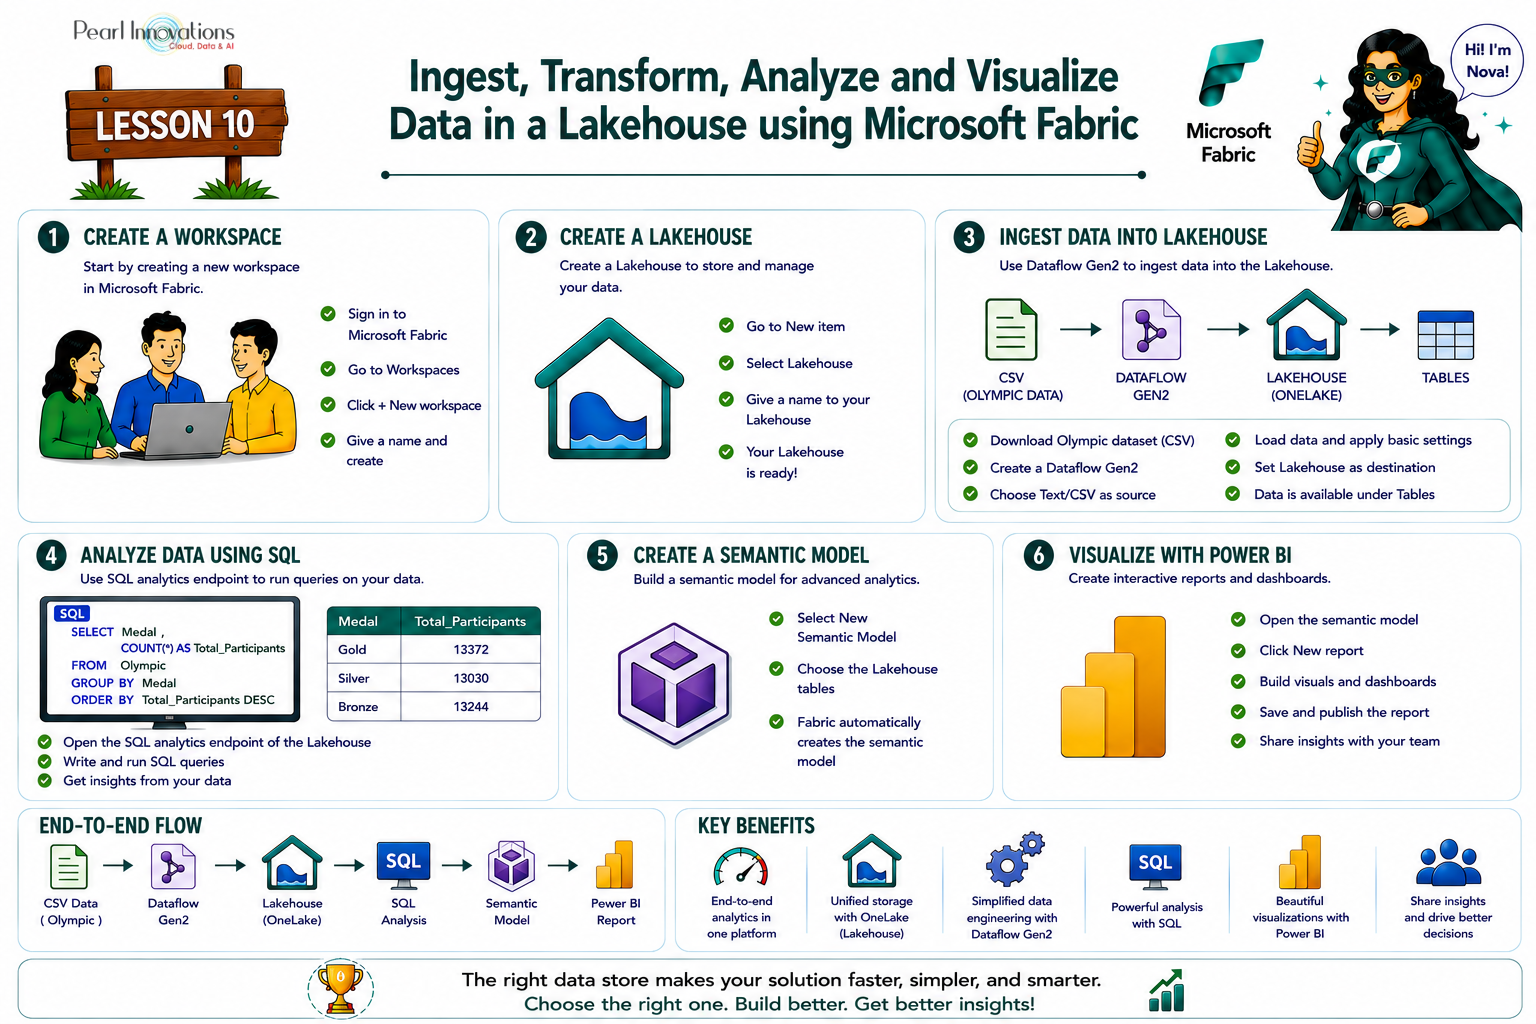
🚀 Learn It in 5 Minutes
Skip the long read.
See the key concepts in one easy-to-follow infographic.
Prerequisites
- Fabric capacity or Trial License.
- Launch https://app.fabric.microsoft.com/ and start your free trial with Microsoft Fabric.
Refer Lesson – 3 Getting started with Microsoft Fabric blog
Step 1 – Create workspace
Follow the steps to create a workspace in Microsoft Fabric.
- Sign into Fabric portal.
- Click Home–> New Workspace
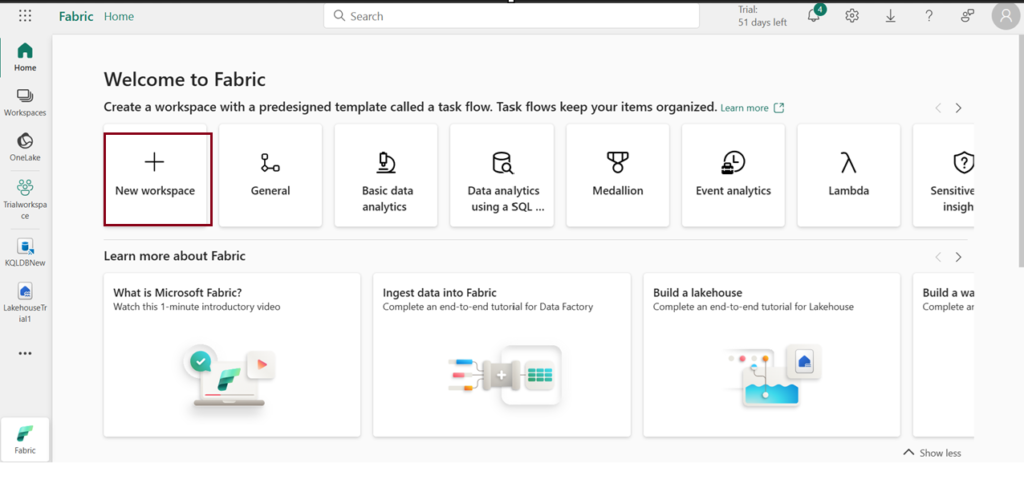
Take a look at the Lesson – 4 Fabric workspace blog post for more detailed information.
Step 2 – Create Lakehouse
Follow the steps to create lakehouse
- In the workspace view, click on “New items “.
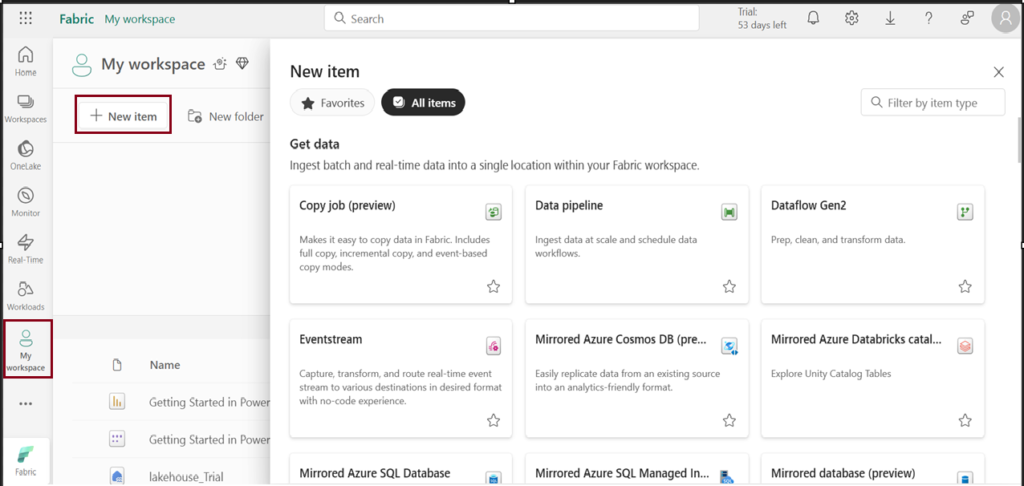
- Choose “Lakehouse” under Store data option.
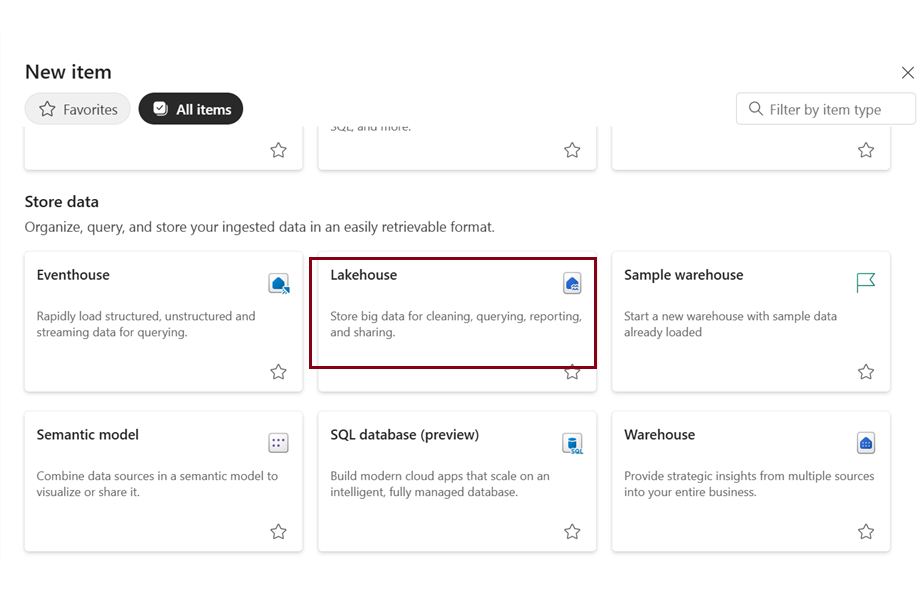
- A prompt window will appear; type the desired name for the lakehouse you want to create and click “Create”.
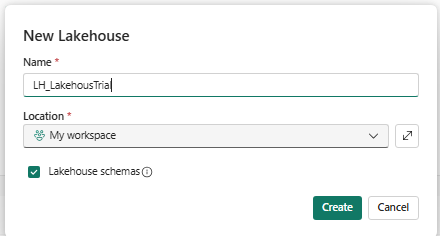
Refer Lesson 7 Getting started with Microsoft Fabric Lakehouse for detailed information.
Step 3-Ingest Data
- Download the Olympic dataset csv file – (taken from Kaggle).
- Choose the lakehouse name you created, and when you click on it, the lakehouse explorer will appear.
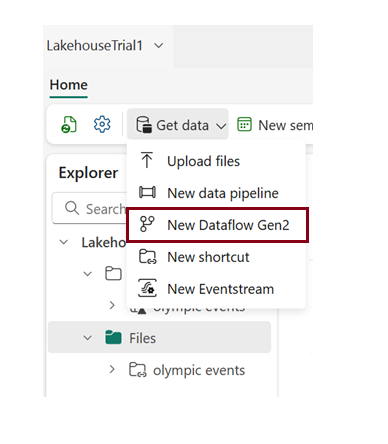
- In the Lakehouse explorer, click on New Dataflow Gen2.
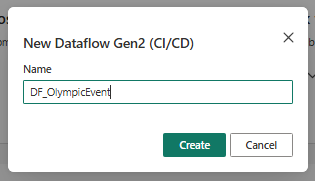
- When the New Dataflow pane opens, select the dropdown arrow to modify the name of the dataflow.
- Following are the ways to import data
- In the Dataflow pane, click on the Import from a Text/CSV file to import data.
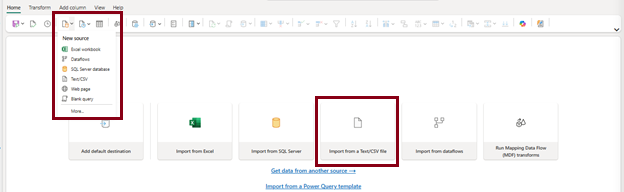
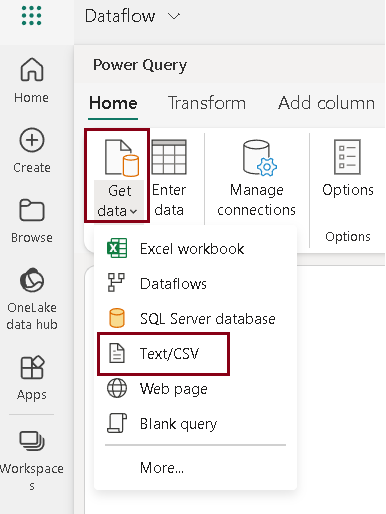
2. Select the “Get Data” dropdown arrow, and you will see the options displayed below. Choose “Text/CSV” to import the dataset.
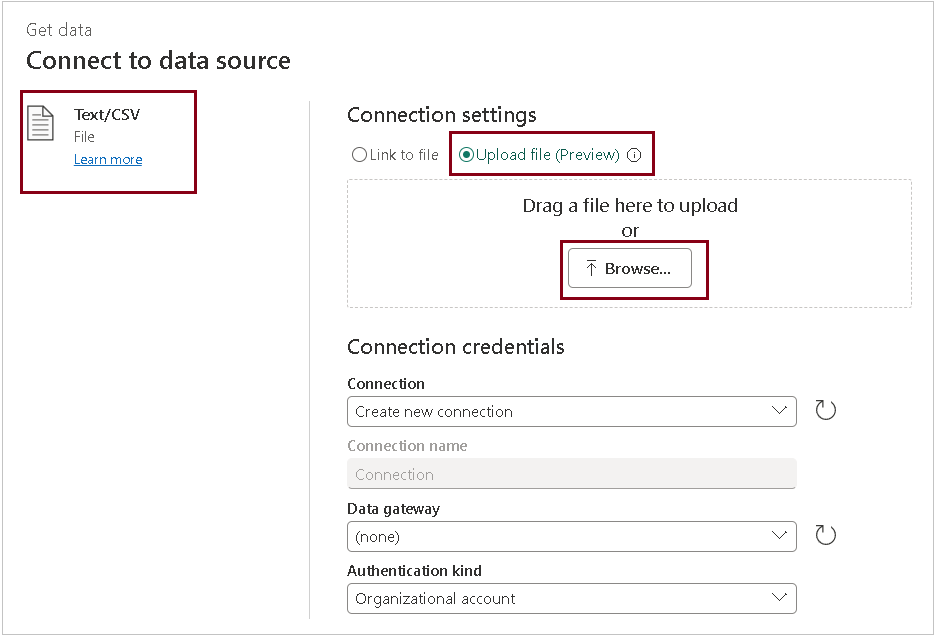
- The subsequent window will appear, click the “Browse” button to choose the Olympic dataset you downloaded.
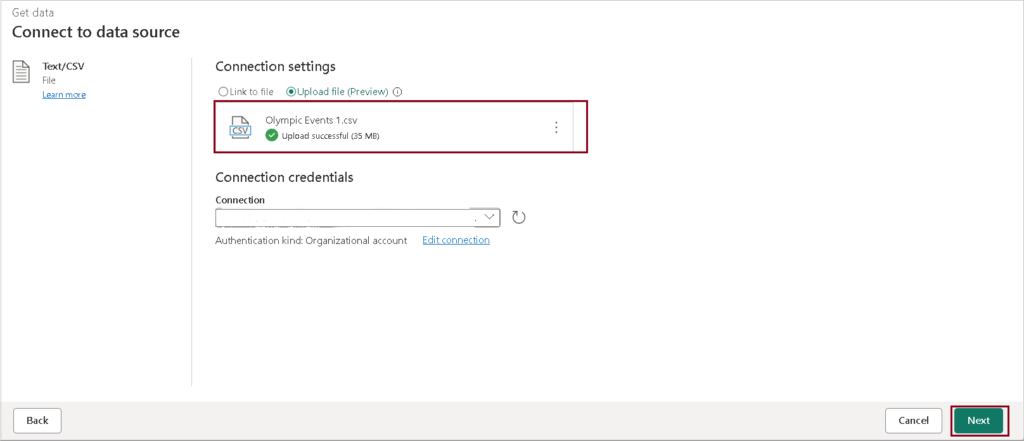
- The Olympic dataset has been uploaded. Click Next.
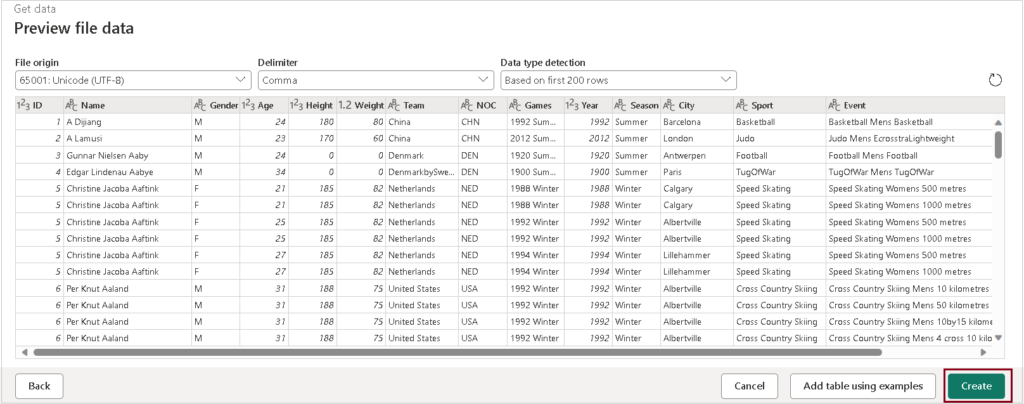
- The dataset preview is visible now, click on “Create” to proceed.
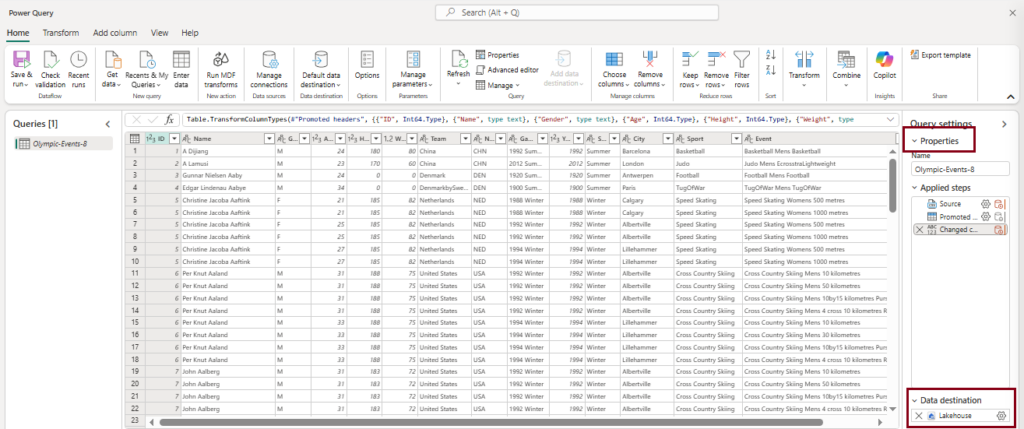
- In the following window, take the following actions:
- In the “Properties” pane, provide a name for the dataset.
- In the “Data Destination” section, choose “Lakehouse”.
- Click “Save Setting” to load the dataset into the lakehouse you created.
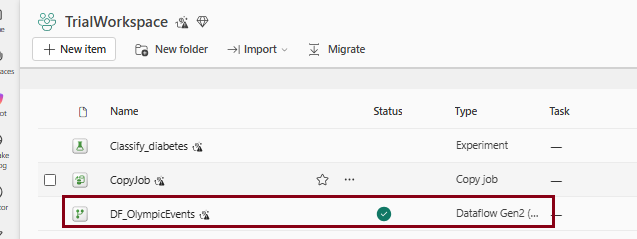
- Go to the workspace you made. Look for the Lakehouse you created and the associated dataflow. Click on the specific Lakehouse that you’ve set up.
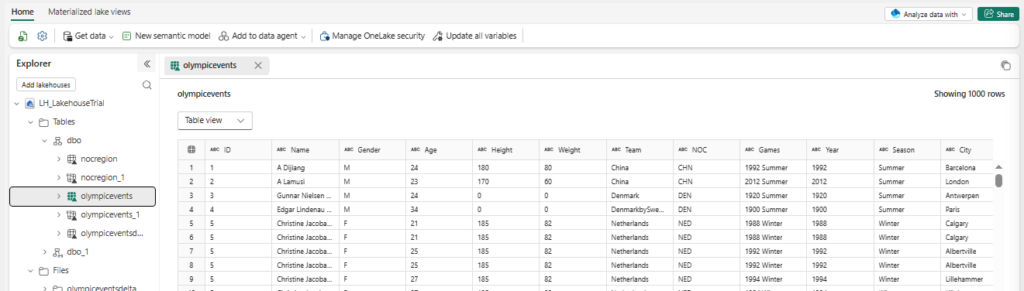
- Within the Lakehouse Explorer, you’ll now see the dataset located under the “Tables” folder.
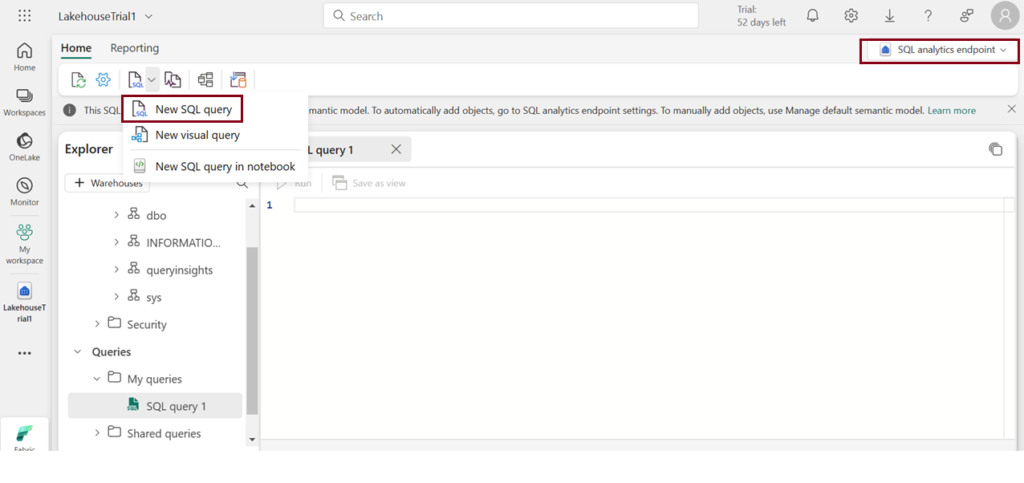
- Select the SQL analytics endpoint from the Lakehouse drop-down menu at the top right corner of the screen. Once you do that, the following pane will appear. Choose “New SQL Query” to begin writing SQL queries.
- This query retrieves the count of participants for each medal type from the “Olympic dataset” and groups the results by the “medal” column. The alias “Number of Participants” is assigned to the count for clarity in the output. Click Run to run the query.
Step 4 – Visualize the data
- Go to the Lakehouse you established and choose the New Semantic Model
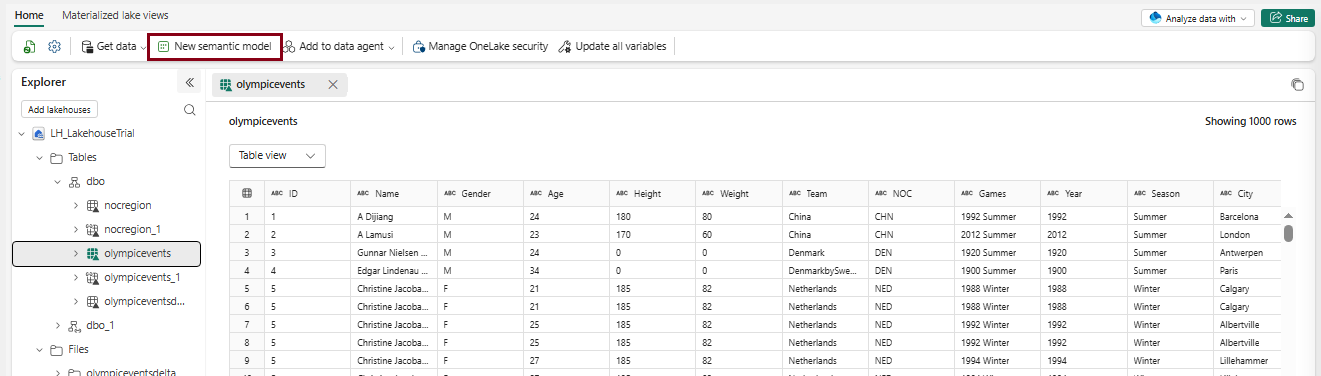
In the Semantic Model pane, you will find a list of all available tables. Additionally, you have the flexibility to create reports, whether from scratch, through a paginated report, or by allowing Power BI to automatically generate a report based on your data.
- Follow the below step to create the report.
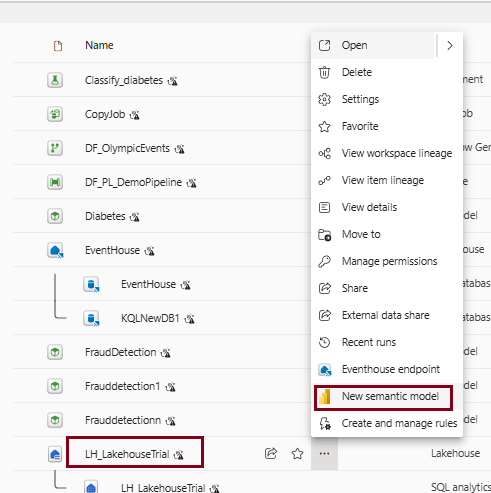
1. In the Workspace view, click on More options (…) next to the Lakehouse , and then select “New Semantic Model” and Choose Tables . It will automatically generate a Semantic Model of the dataset you have loaded.
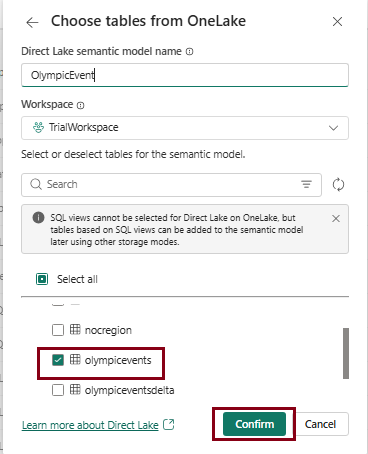
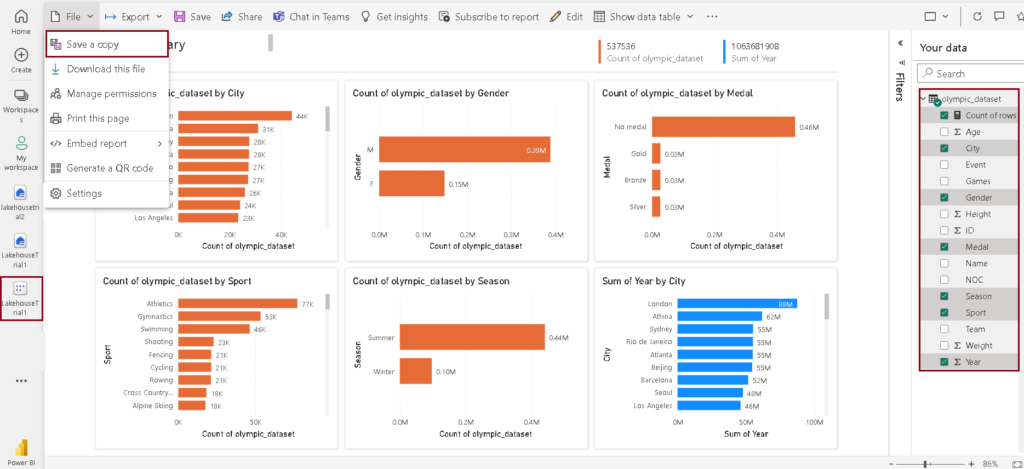
- A semantic model is automatically created for the Lakehouse data. Open the semantic model, choose File > New report, create the required visualizations, and save the report.
| Tags | Microsoft Fabric |
| Useful links | |
| MS Learn Modules | |
Test Your Knowledge |
Quiz |