
This blog will guide you through the process of ingesting data using Dataflows Gen2 in Microsoft Fabric. The step-by-step instructions and insights provided here aim to make data management a straightforward and efficient experience.
Prerequisite
- Acquire a Microsoft Fabric tenant account that includes an active subscription. Refer Lesson 3 – Getting started with Microsoft Fabric
- Confirm the existence of a Microsoft Fabric-enabled Workspace that is configured and prepared for utilization. Refer Lesson 4 – Fabric Workspaces and how to create one?
- Establish a Lakehouse. Refer Lesson 7 Getting started with Microsoft Fabric Lakehouse
- Navigate to the workspace you created. Select New item and choose “Dataflow Gen2”, power query editor for your new dataflow opens.
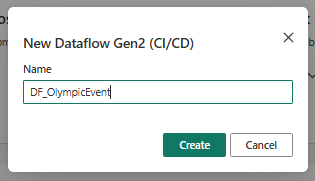
- Create a Dataflow with Proper Naming convention like DF_Olympic Event.
- Download the datasets. The datasets are taken from Kaggle
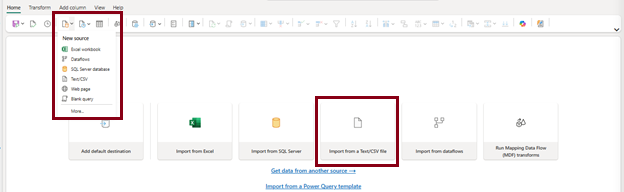
- Choose either Get data -> Text/CSV or dataflowgen2 home page->Import from a Text/CSV file to acquire the datasets you have downloaded.
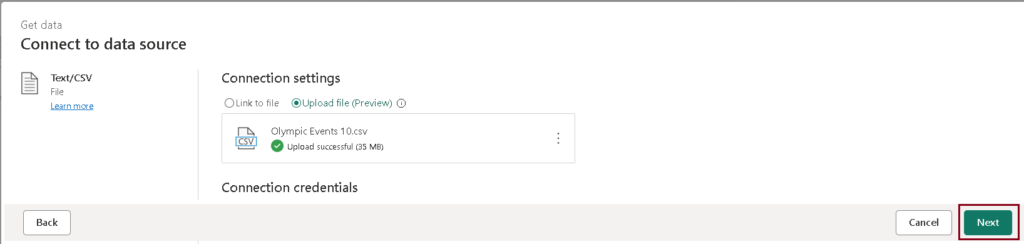
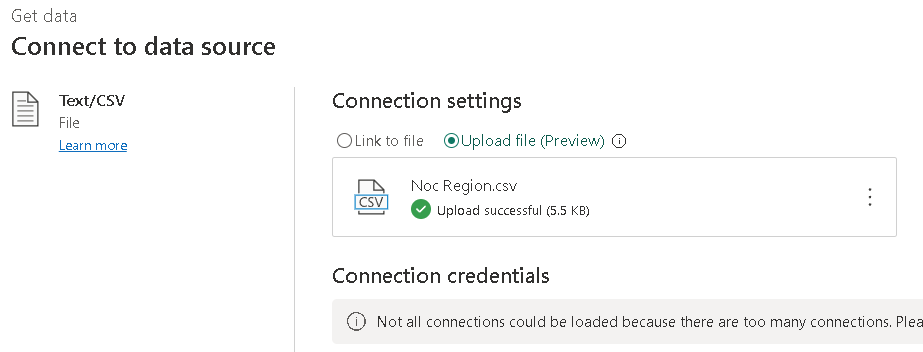
- Select Upload file(preview) to load the datasets as shown below.
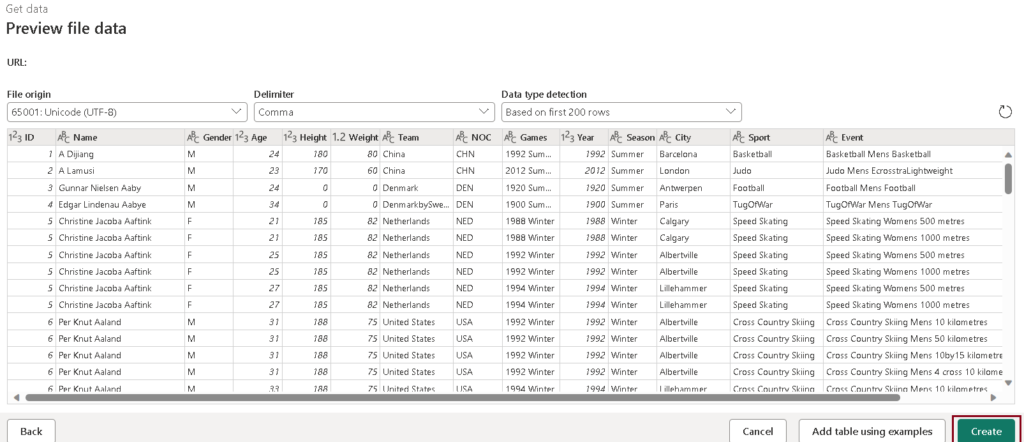
- Click on “Next” to preview the data, and then proceed to create the data source.
- Within the Power Query editor, you’ll see the data source along with an initial series of query steps designed for formatting the data. Apply transformations and publish the dataflow.
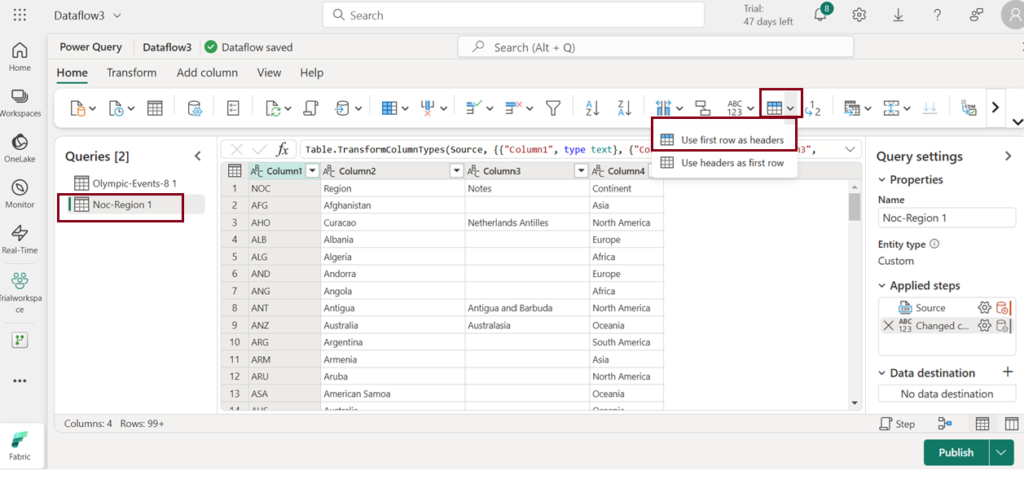
- To designate the first row from the table as the header, select the option “Use first row as headers” in the toolbar.
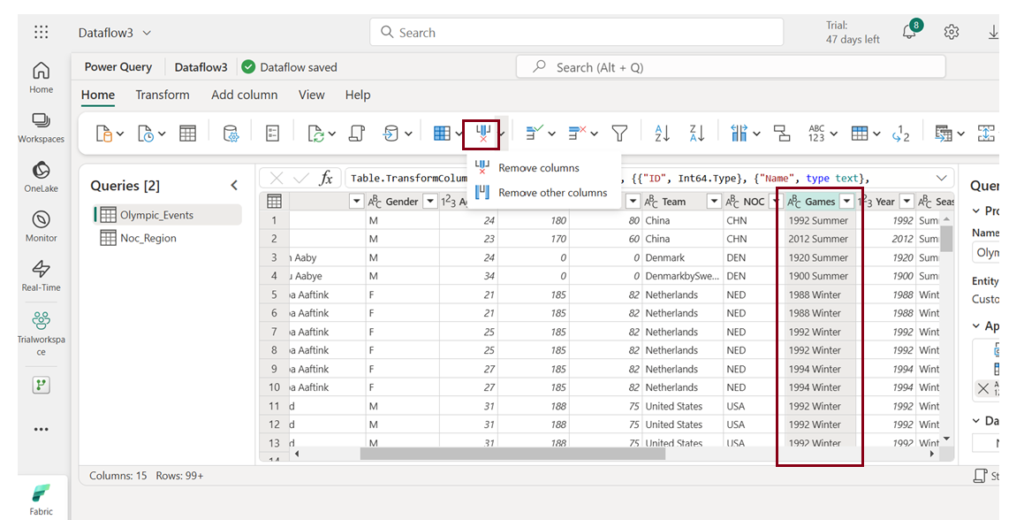
- Identify the columns you wish to exclude from analysis, then highlight them and choose “Remove columns” to delete them.
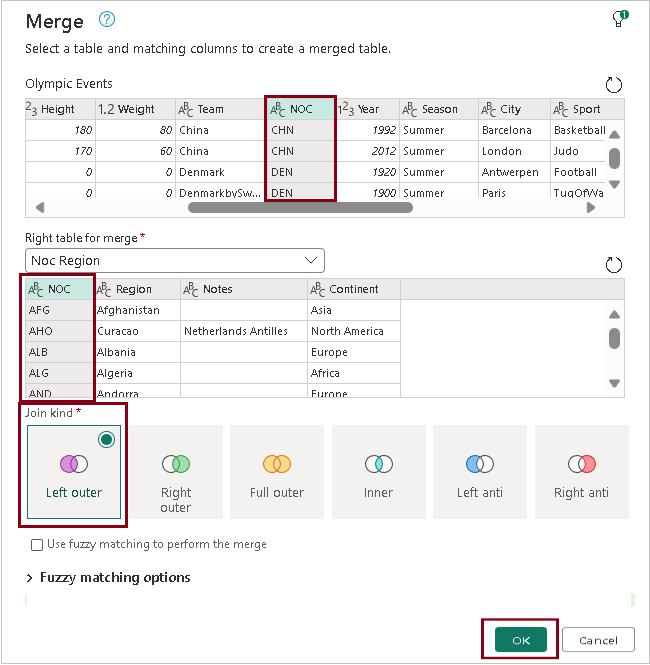
- You can merge tables by following these steps:
- Choose the table you intend to merge, then pick columns from both tables. Specify the type of join you wish to perform and click “OK.”
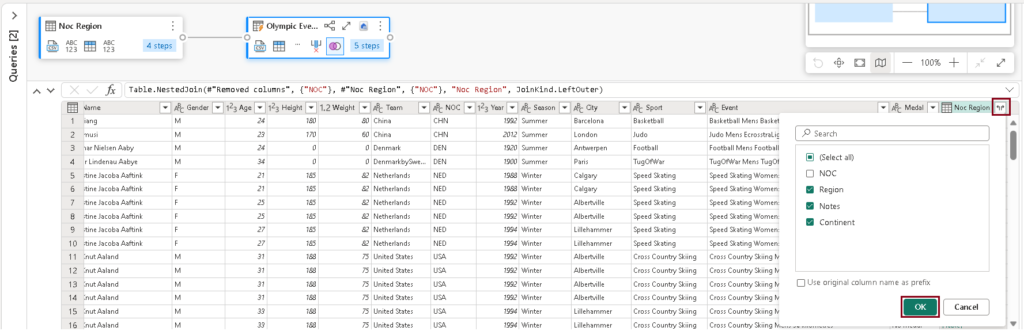
- After merging the tables, click the expand symbol to choose the columns you want to include. Then click “OK”.
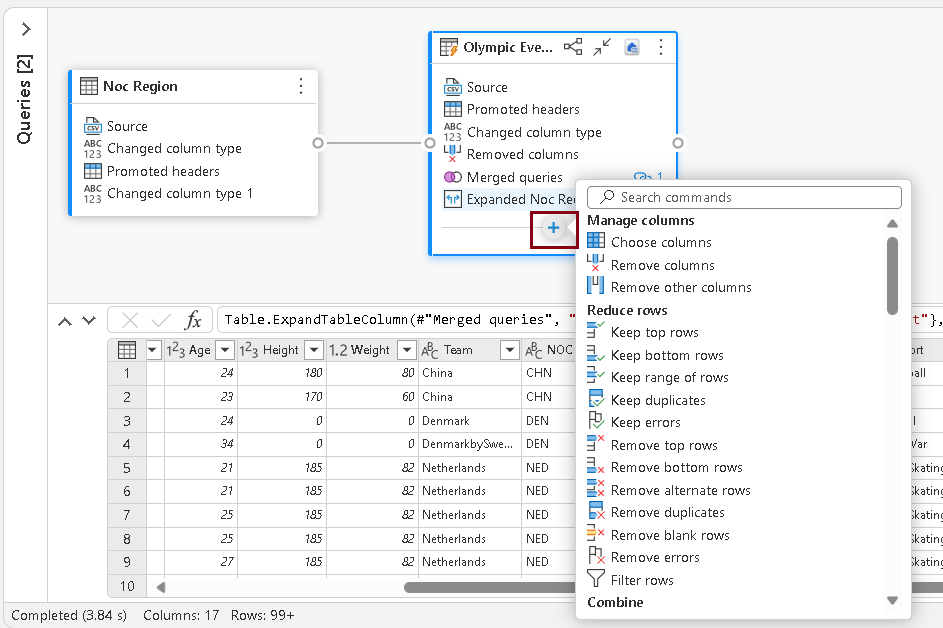
- Click on the “+” symbol at the bottom of diagrammatic view of the table to access a set of transformations that can be applied to the table. This feature is provided for users to enhance their experience and execute various transformations on the table.
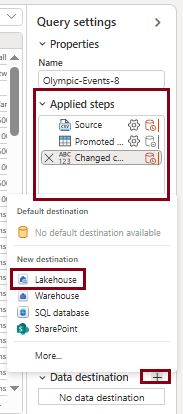
- In the query settings pane, click on the “+” symbol next to Data destination, and choose “Lakehouse” as the data destination.
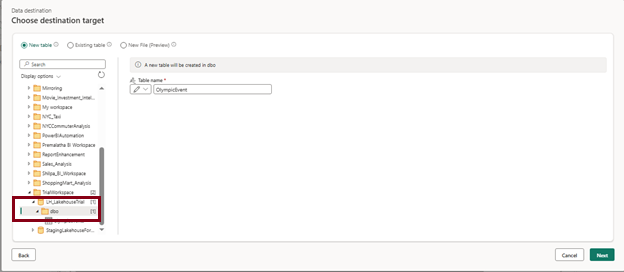
- In the “Connect to data destination” window, choose “Lakehouse” as the connection, and then click “Next.”
- In this window, you’ll find a list of available workspaces. Select your workspace, choose the lakehouse where you want to load the table, and provide the necessary table name.
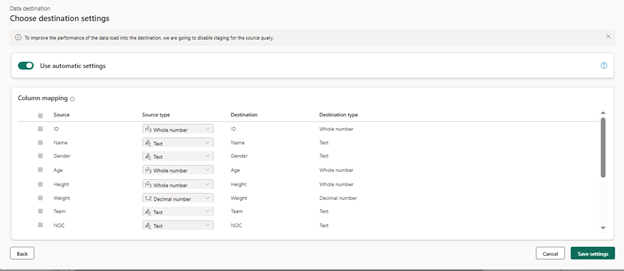
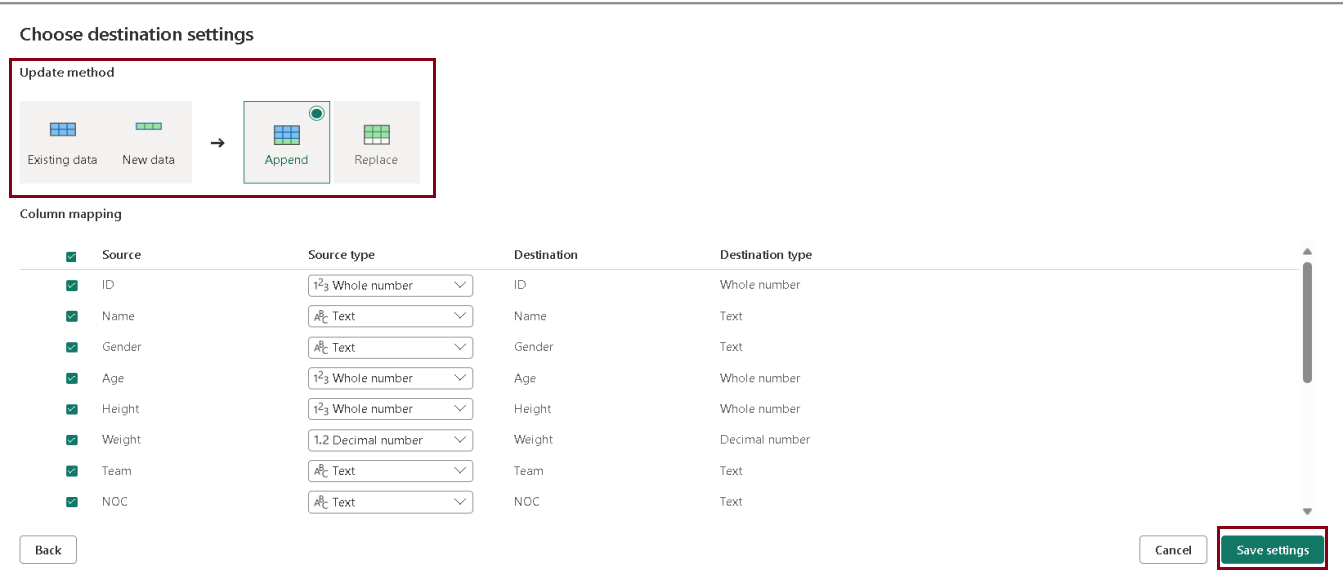
- On the “Choose destination settings” page, select “Append,” and then save the settings. You have the option to update the data types as needed.
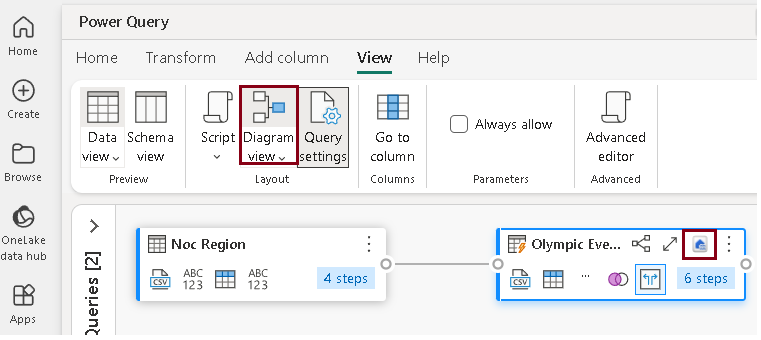
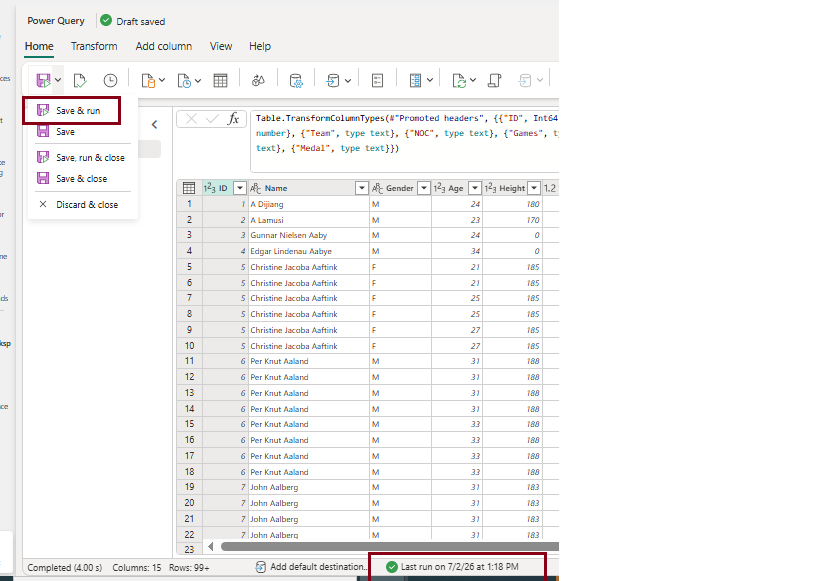
- On the menu bar, go to View and choose Diagram view. Observe that the Lakehouse destination is represented by an icon in the query within the Power Query editor.
- Click Save and Run to execute the dataflow.
- Once the process completes successfully, the data will be published to the Lakehouse. Refresh your Lakehouse to verify that the data has been loaded successfully.
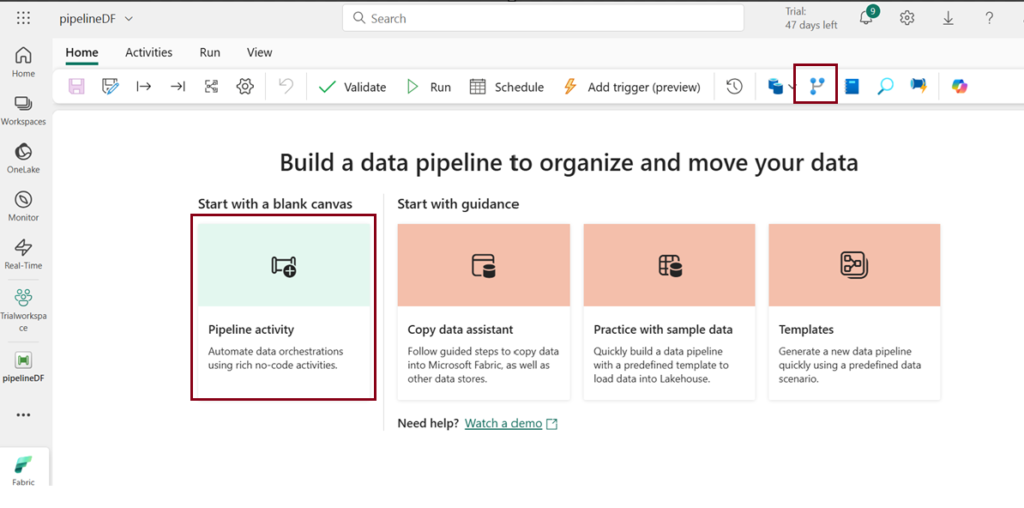
- Ensure you are still in the Data Engineering experience from your Fabric-enabled workspace. Click on “New,” then choose “Data pipeline.” Follow the prompts to create a new pipeline named “pipeline1.” The pipeline editor will open.
- On the menu bar, click on “Dataflow” activity to add it to the pipeline.
- Once you’ve chosen the Dataflow1 activity, navigate to the Settings tab. In the Dataflow drop-down menu, select “datapreparationflow,” the data flow you previously created.
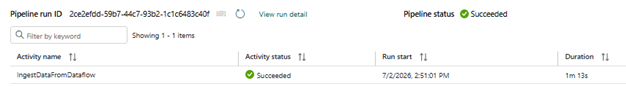
- Upon completion of the pipeline execution, the Output tab displays the pipeline status as “succeeded,” indicating that the execution was completed without errors.
- In the event of an error during pipeline execution, the Output tab will also indicate the occurrence of the error, providing relevant information about the issue encountered.
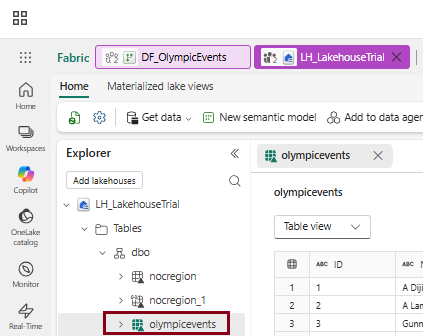
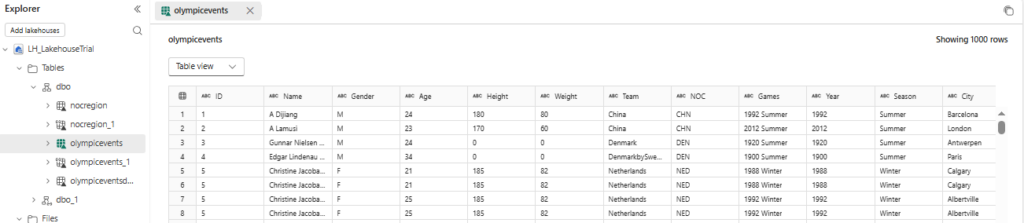
- On the menu bar on the left edge, select the lakehouse that you assigned as the destination for the table.
- In the Explorer pane, click on the (…) menu for Tables, choose “Refresh,” and then expand the Tables section and Select schema section to select the “Olympic_Events” table created by your dataflow.
- Ingest Data with Dataflows Gen2 in Microsoft Fabric
Create a Dataflow Gen2 to ingest data

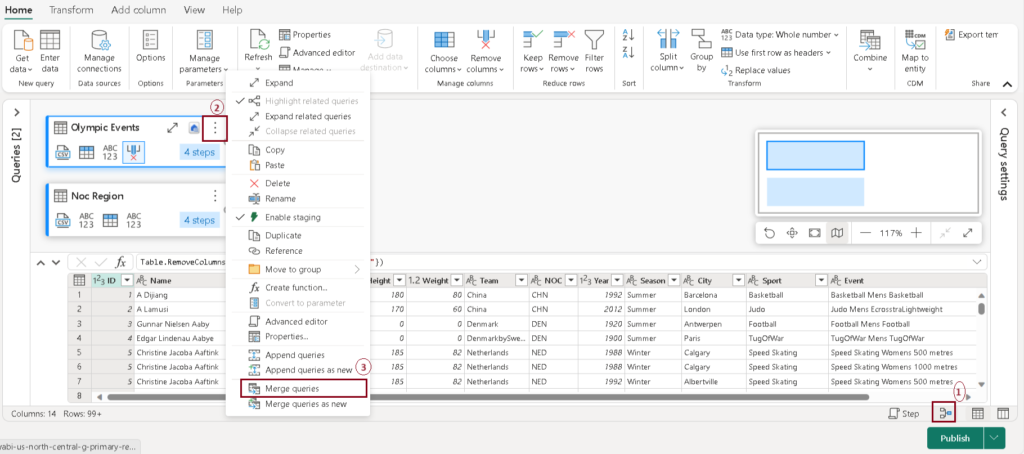
1– Choose the “Diagrammatic view” option at the bottom to visualize the tables in diagram representation.
2 – Select the table you wish to merge, then click on the ellipsis (three dots) next to the table name and opt for “Merge queries” (3).
Add data destination for data flow
Note: If the add data destination option in the toolbar is greyed out, it’s likely that you’ve already chosen a data destination. Verify this at the bottom of the query settings pane, and if needed, you can change the destination by selecting the appropriate option.
Refer Lesson 18 – Introduction to Pipelines in Microsoft Fabric
Add dataflow to a pipeline
You have the capability to integrate a dataflow as an activity within a pipeline. Pipelines can be created within different interfaces, including Data Factory experience.
Refer to Lesson 18 – Introduction to Data Pipelines in Microsoft Fabric for a step-by-step guide.
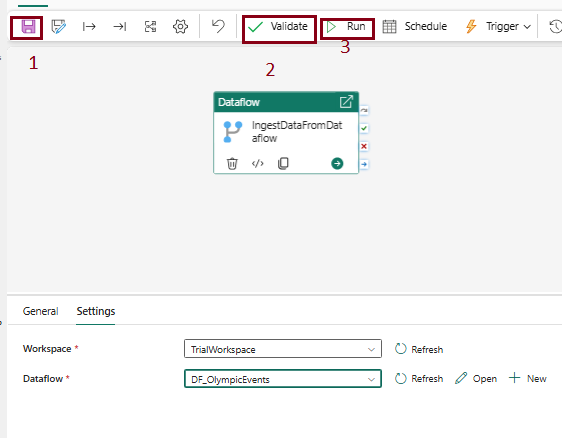
1. On the Home tab, click the save icon to save the pipeline.
2. Click “Validate” to check and confirm the pipeline’s correctness.
3. After the validation is complete, click the “Run” button to execute the pipeline. It may take a few minutes to finish the process.
| Tags | Microsoft Fabric |
| Useful links | |
| MS Learn Modules | |
Test Your Knowledge |
Quiz |