
As organizations strive to unlock insights from vast and diverse datasets, the emergence of the lakehouse architecture has become an important development in the field of data analytics. This blog explores the seamless integration of Power BI, a powerful business intelligence tool, with the lakehouse architecture for efficient data management and analytics.
Benefits of utilizing Power BI with a lakehouse
- Seamless Access to Large Datasets – Access and analyse extensive data stored in standard formats within a data lake without the need for data duplication or importation into a Power BI model.
- Enhanced Query Performance – Leverage the indexing protocols and query optimization capabilities of a lakehouse to achieve low latency and high reliability for both business intelligence and advanced analytics.
- Direct Lake Mode Efficiency – Utilize the Direct Lake mode to directly load data from OneLake into the Power BI engine, combining the strengths of DirectQuery and import modes while avoiding their drawbacks.
- Streamlined Data Processing – Employ Data Engineering tools for efficient data ingestion and transformation into the lakehouse, enabling Power BI to seamlessly create reports and dashboards using the same data source.
Power BI with Lakehouse
Follow the steps to use Power BI with Lakehouse
Pre requisites
- Acquire a Microsoft Fabric tenant account that includes an active subscription. Refer Lesson 3 Getting started with Microsoft Fabric.
- Confirm the existence of a Microsoft Fabric-enabled Workspace that is configured and prepared for utilization. Refer Lesson 4 Fabric Workspaces and how to create one?
- Create Lakehouse Refer Lesson 7 Getting started with Microsoft Fabric Lakehouse
- Download the CSV files (Taken from Kaggle)
Load data into Lakehouse
- Navigate to the Lakehouse you created.
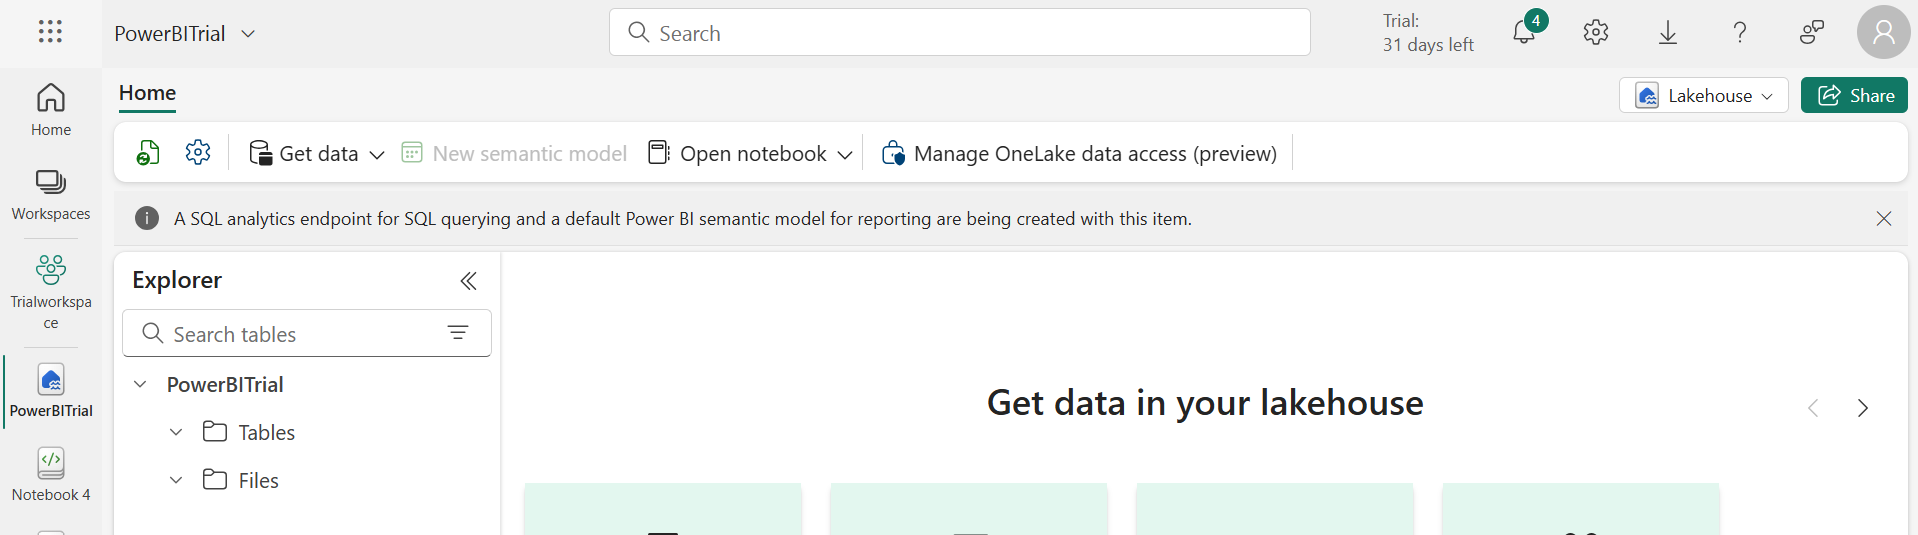
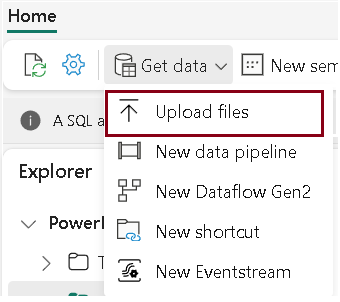
- Click Get data–> Upload files to upload the csv files.
- The files have been uploaded. Here, you have the option to choose to overwrite the existing file or delete it if mistakenly loaded.
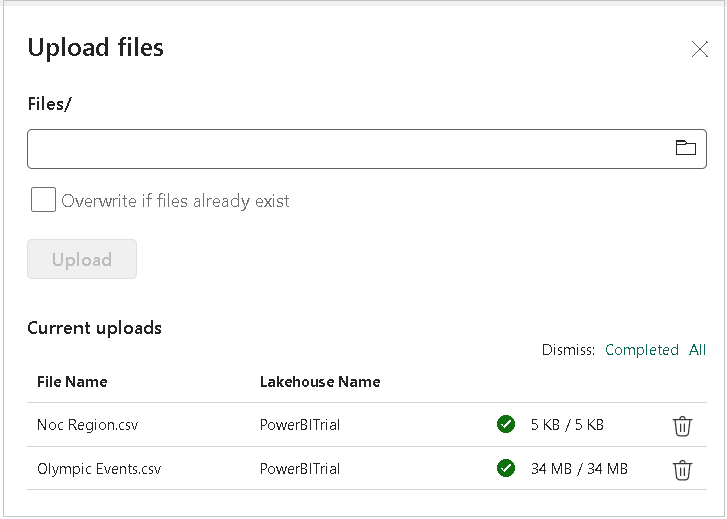
Data has been loaded in the files folder.
Create Delta tables
Once you’ve established a new Lakehouse, it’s essential to create at least one delta table to enable Direct Lake to access specific data. Direct Lake has the capability to read files formatted in parquet.
You can easily create a Delta table using the user-friendly Lakehouse explorer interface, allowing you to load various file formats into tables effortlessly.
Create a basic Direct Lake model for your Lakehouse
- Navigate to your Lakehouse page and opt for the “New semantic model” feature. This action will prompt a dialog box to appear.
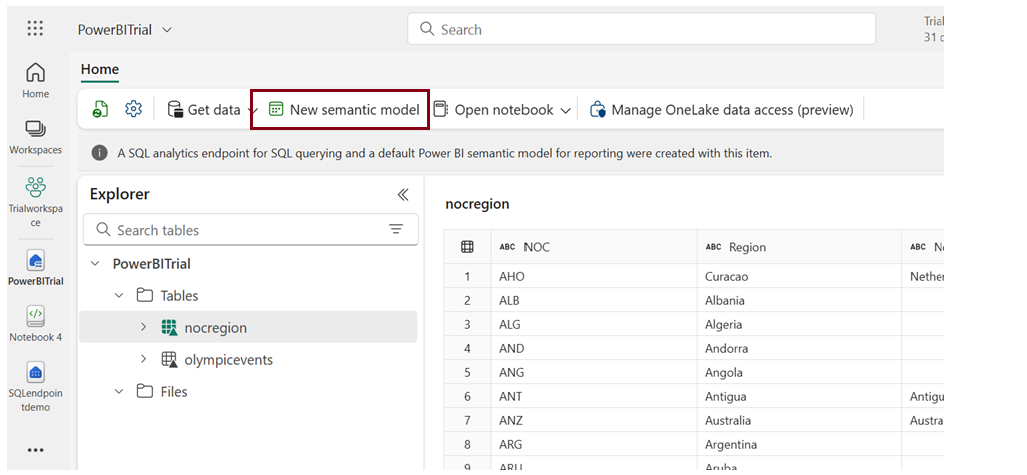
- In this dialog, choose the tables you wish to include and specify the workspace where you want to save the semantic model.
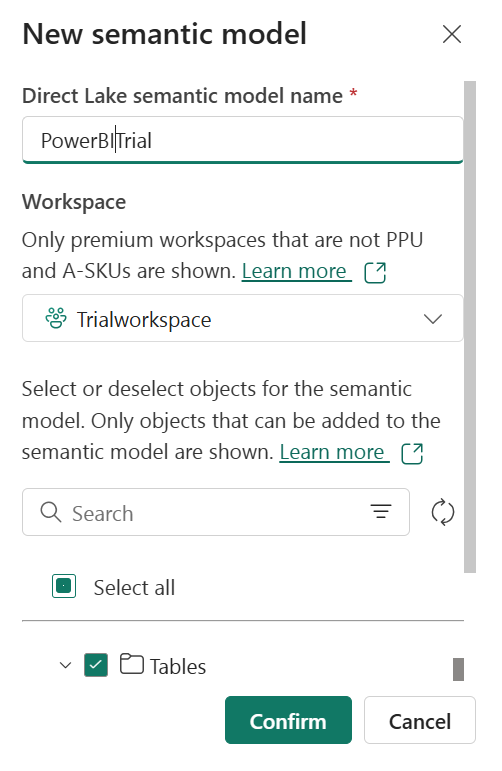
- Click on “Confirm” to generate the Direct Lake model. The model will be automatically saved in the workspace, using the name of your Lakehouse, and will subsequently open for further modifications.
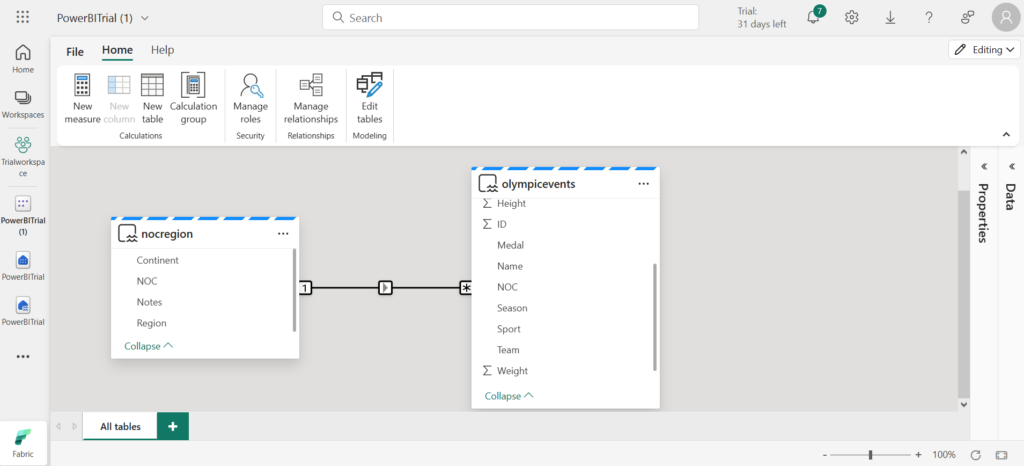
- Upon clicking “Confirm,” it directs you to the data model page.
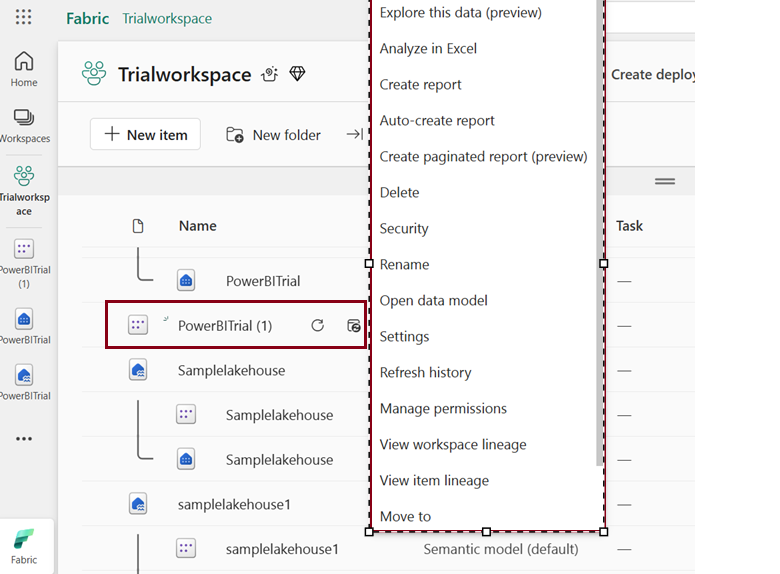
You can access the data model later through the workspace.
- Navigate to the workspace where the semantic model is saved.
- Click on the ellipsis (…) near the semantic model’s name you created and choose “Open Data Model” from the options.
Once you’ve finished establishing relationships and implementing DAX measures, you can move on to creating reports.
Semantic model details
To access details about the semantic model,
- Navigate to the workspace where you stored the semantic model. Click on the semantic model, and you will be directed to the following screen.
- It showcases details about the semantic model, including its location, the date of the last refresh. You also have the option to explore the data further and share it with others.
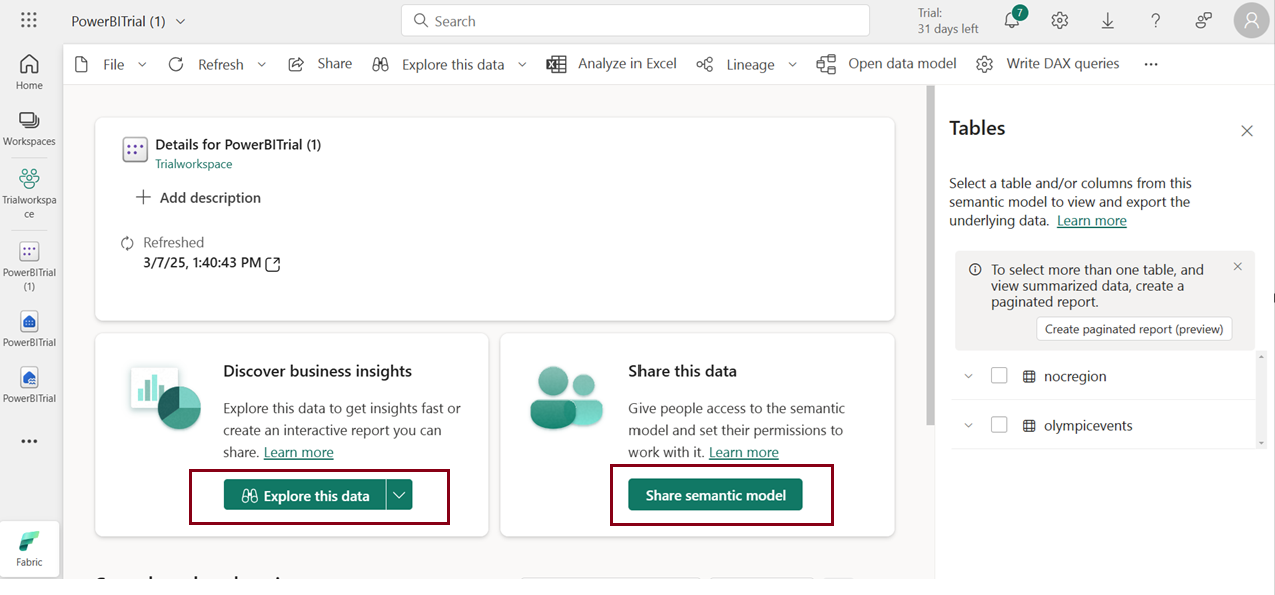
- Under the “Explore this data” section, you will find various options such as ‘Auto-create report’, ’Create a blank report’, and ‘Create paginated report’.
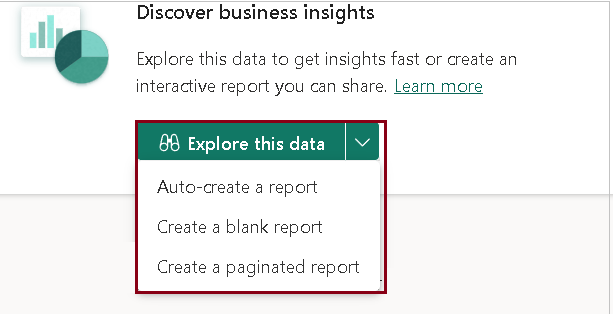
- Click on “Explore this data” to delve into the provided dataset.
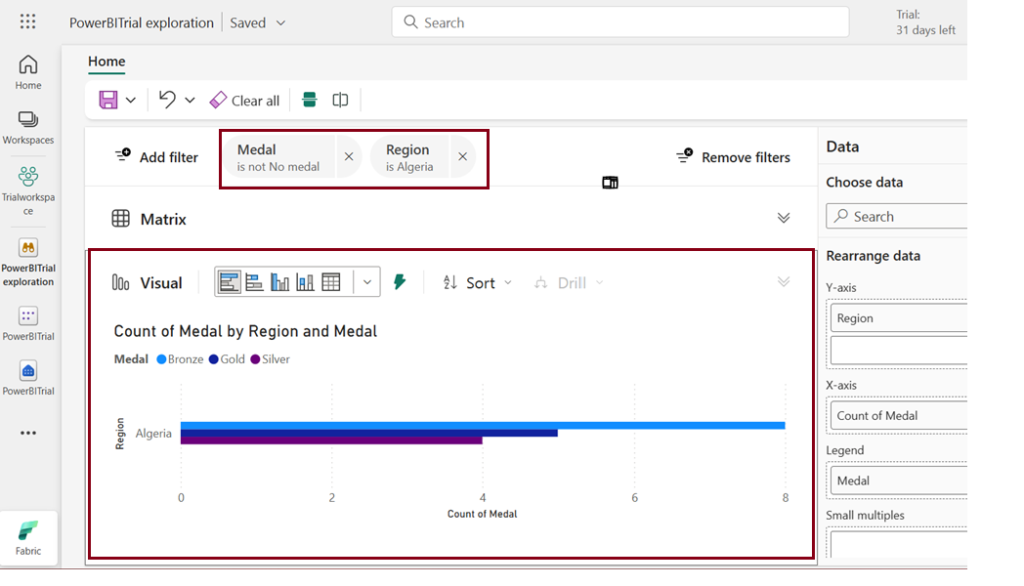
- You have the ability to add or remove filters and explore the data in the default matrix format.
Visualise the data
Visualizing data involves presenting information graphically through charts and graphs, enhancing understanding and revealing patterns. It simplifies complex data, aids in insight discovery, supports decision-making, and communicates findings effectively. Choose appropriate visualizations, keep it simple, use colour purposefully, and provide context for a compelling and impactful representation of data.
- You have the option to visualize the explored data.
- Click “Save” to save it as a report.
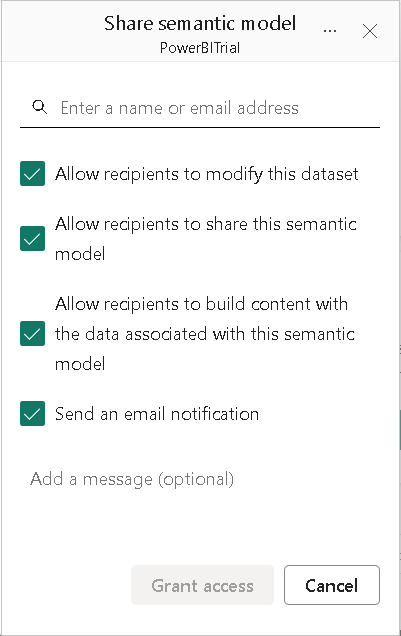
Share semantic model
Sharing a semantic model enables easy collaboration and distribution of insights within your team or organization. This feature lets multiple users work together on the same model, facilitating shared understanding and informed decision-making. It’s especially useful when different individuals or teams need access to a standardized view of the data.
Auto – create reports
Generating reports is easy and can be done in two ways: either
Through the workspace
- Within the workspace view, hover over the semantic model’s name PowerBITrial. Click on the ellipses (…) à “Auto-create report” option.
- Click on “Explore this data” and then choose “Auto-create report.”
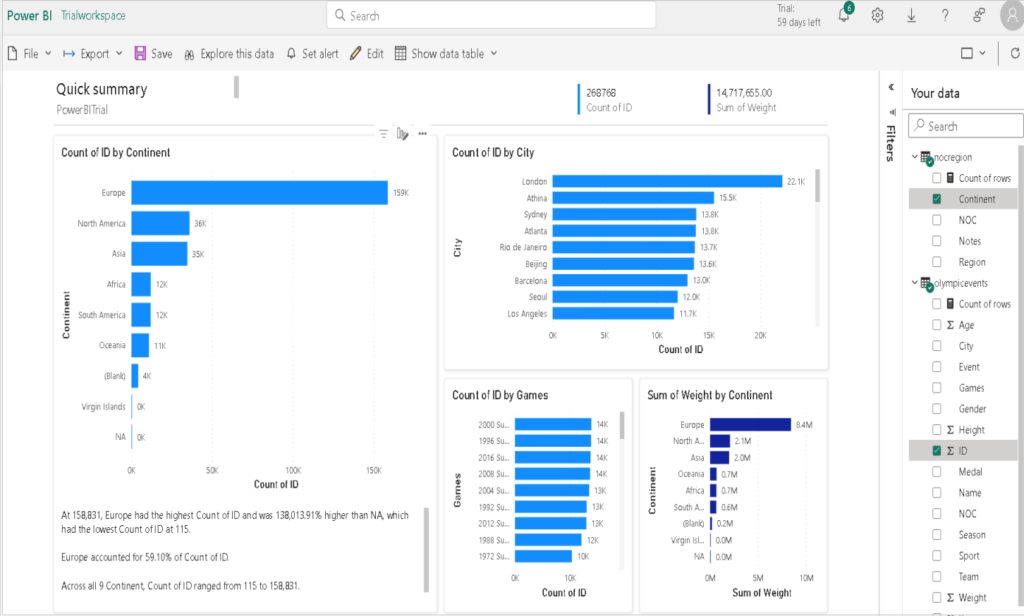
This streamlined process swiftly creates reports without manual intervention, providing a quick and efficient way to visualize and analyze data.
| Tags | Microsoft Fabric |
| Useful links | |
| MS Learn Modules | |
Test Your Knowledge |
Quiz |