Microsoft Fabric provides Data Science tools that empower users to conduct comprehensive end-to-end data science workflows. Users can seamlessly navigate through various activities in the entire data science process, covering data exploration, preparation, cleansing, experimentation, modelling, scoring, and delivering predictive insights to business intelligence reports.
Data Science process
Microsoft Fabric simplifies the data science process by offering capabilities tailored to each stage
- Problem formulation and ideation – Collaborate with business users and analysts to comprehend project goals. Utilize Power BI reports and datasets for a preliminary understanding of data and business context.
- Data Discovery and Pre-processing – Connect to diverse data sources and ingest data into a Fabric lakehouse. Leverage data integration pipelines for building and orchestrating ingestion and transformation processes. Utilize Fabric notebooks with Apache Spark to read and write data, employing additional libraries as needed.
- Microsoft Fabric provides various tools tailored for data exploration and preparation, depending on the data storage location and Notebooks, quickest way for data exploration.
- Microsoft Fabric enables scalable data transformation, preparation, and exploration by leveraging Spark with PySpark/Python, Scala, and SparkR/SparklyR tools, complemented by powerful open-source visualization libraries for enhanced data understanding.
- Microsoft Fabric Notebooks includes Data Wrangler, a tool that helps speed up tasks like cleaning data by creating Python code. This makes it easier to do repetitive jobs and automate processes.
- Experimentation and ML modelling – In Microsoft Fabric, notebooks equipped with PySpark/Python and SparklyR/R can handle the training of machine learning models. Users can leverage a variety of popular ML libraries, including Scikit Learn, through library management tools. MLflow experiments track model training, and Microsoft Fabric integrates a built-in MLflow experience for logging experiments and models.
- The SynapseML (formerly MMLSpark) open-source library simplifies scalable ML pipeline creation, unifying existing frameworks and Microsoft algorithms into a single, scalable API, with a rich ecosystem of tools for predictive model development and pre-trained AI models from Azure AI services.
- Enrich and operationalize – Notebooks can efficiently perform batch scoring of machine learning models, using either open-source libraries for prediction or the scalable universal Spark Predict function in Microsoft Fabric. This function supports MLflow packaged models stored in the Microsoft Fabric model registry.
- Gain insights – Utilize Power BI or similar visualization tools to understand and share insights with stakeholders. Additionally, monitor and assess your models, making updates as necessary.
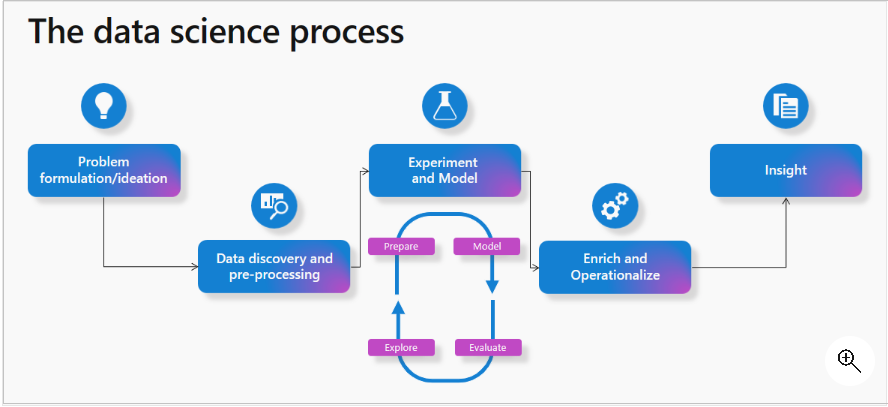
Source: Microsoft learn
How to access data science homepage in Microsoft Fabric?
Follow the steps to access data science homepage
- Launch https://app.powerbi.com/
- Sign into Microsoft Fabric with your subscription or trial account.
Get started with Data Science
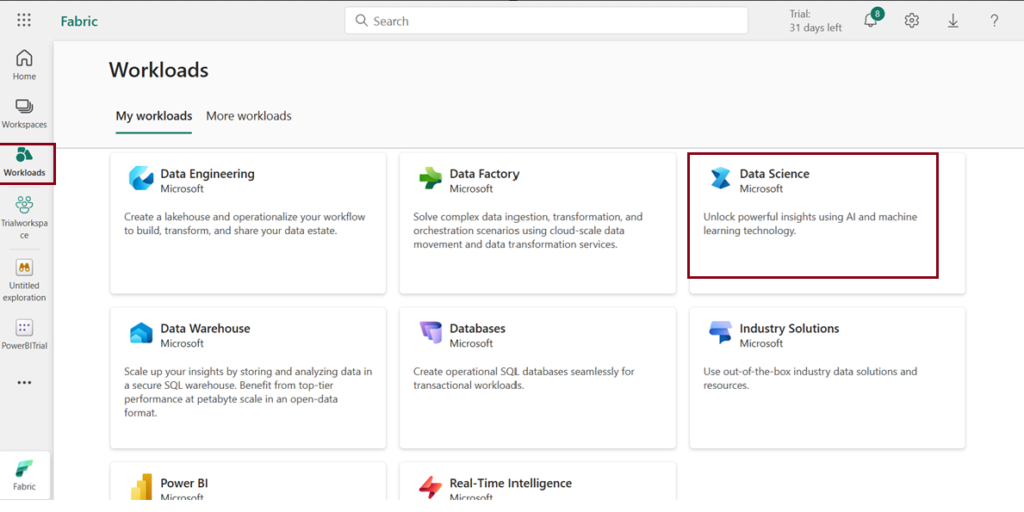
- Navigate to the menu bar on the left side and choose “Workspaces” from the workloads icon to create new workspace.
- Download the given dataset (Taken from Azure open datasets)
- Create Lakehouse and load the given dataset.
- Click Open notebook -> New notebook to create new notebook.
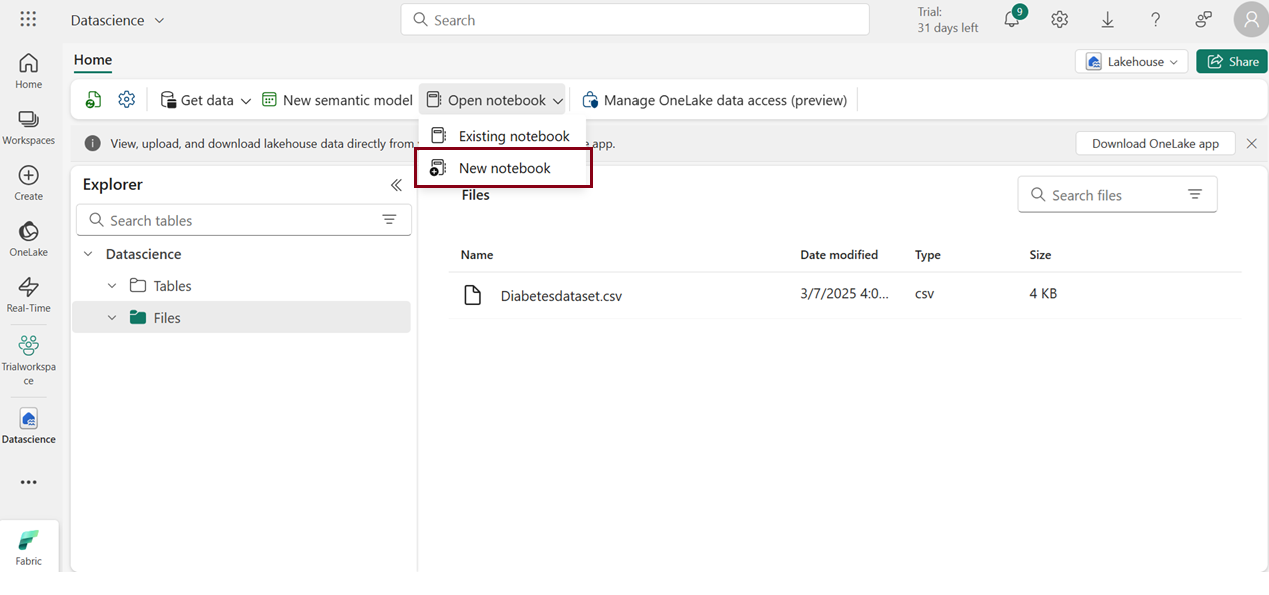
- Within a few seconds, a new notebook will open, comprising a single cell. Notebooks consist of cells that can contain either code or markdown (formatted text).
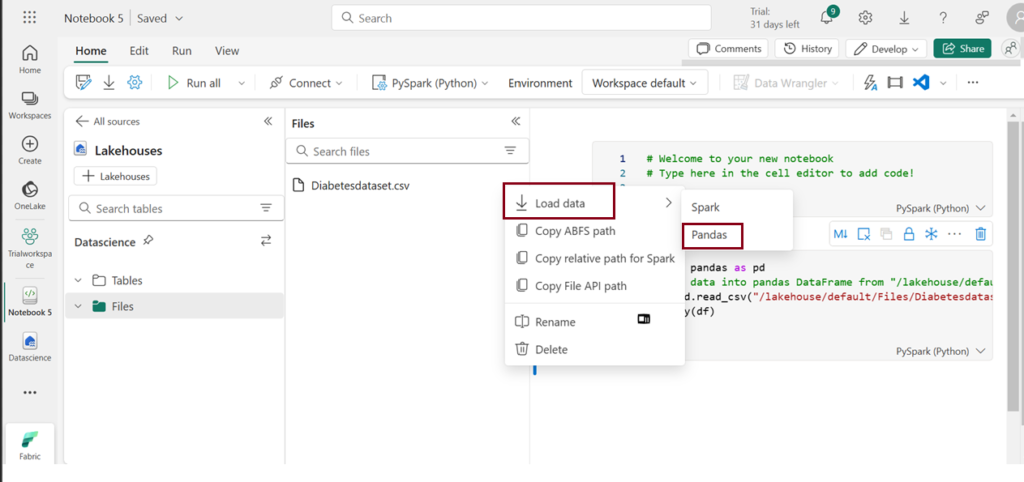
Load data
- Click on the ellipsis icon next to the desired dataset under “Files,” then select “Load Data -> Pandas”. It automatically generates Python script.
- Click Run to run the script.
Output
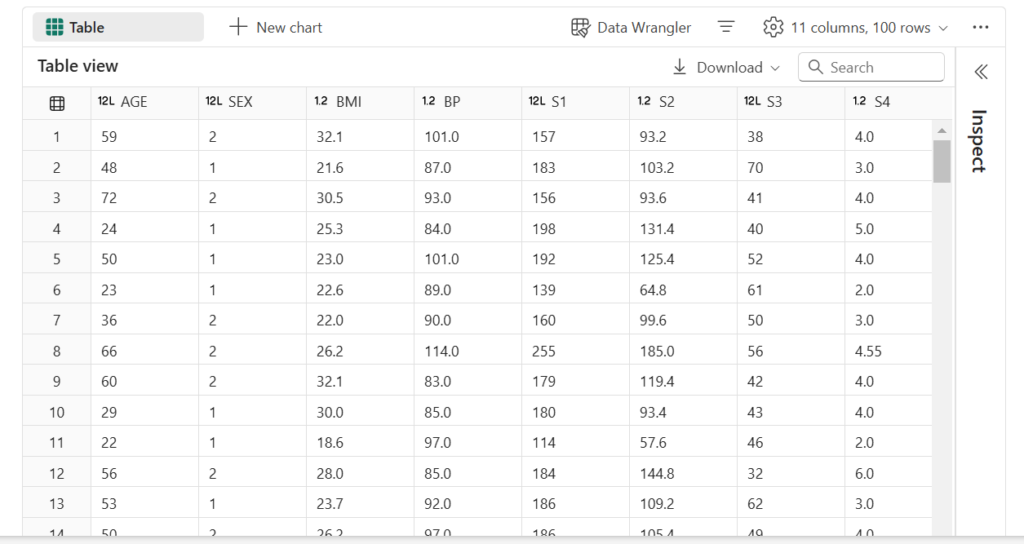
There are two tabs at the top of the table: “Table” and “Chart”
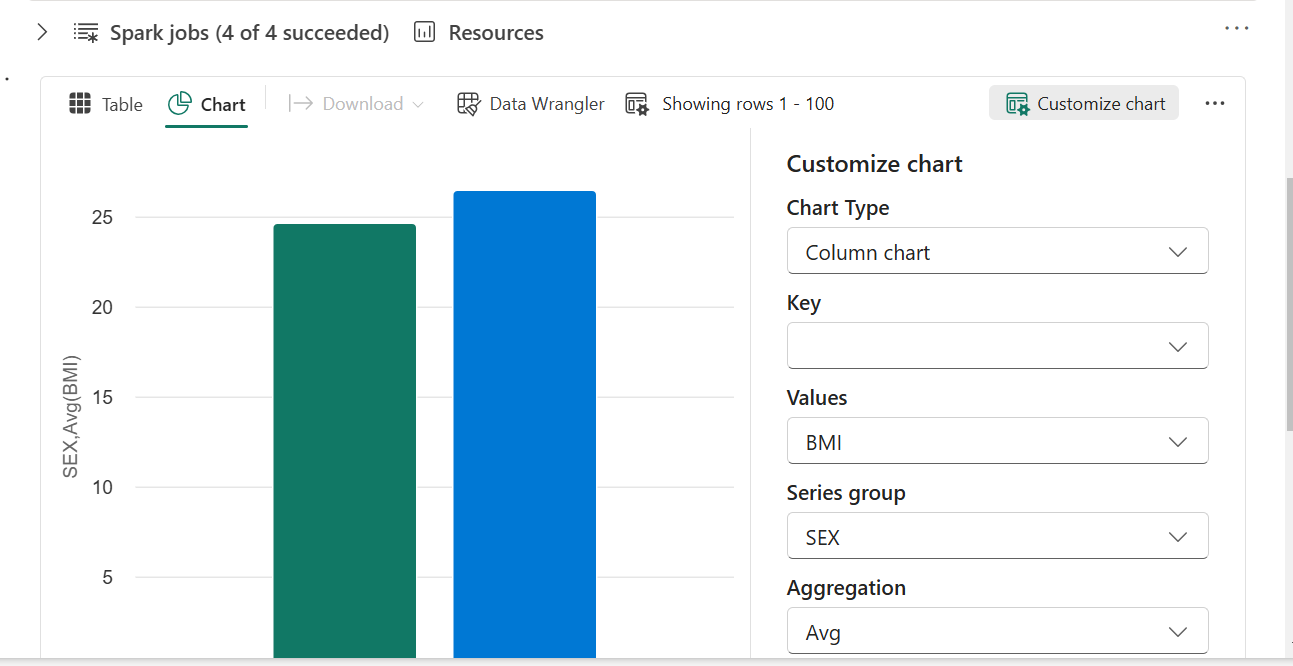
- Switch to the Chart tab.
- Click “Customize chart” at the right corner of the chart to change visualisation.
- Modify the Chart settings according to your preferences, then click “Apply” to generate new visuals and explore the output.
Currently, in Fabric, there have been some changes to the options for the settings mentioned above. We now have a toggle option that allows you to either use the new feature or stick with the old interface.
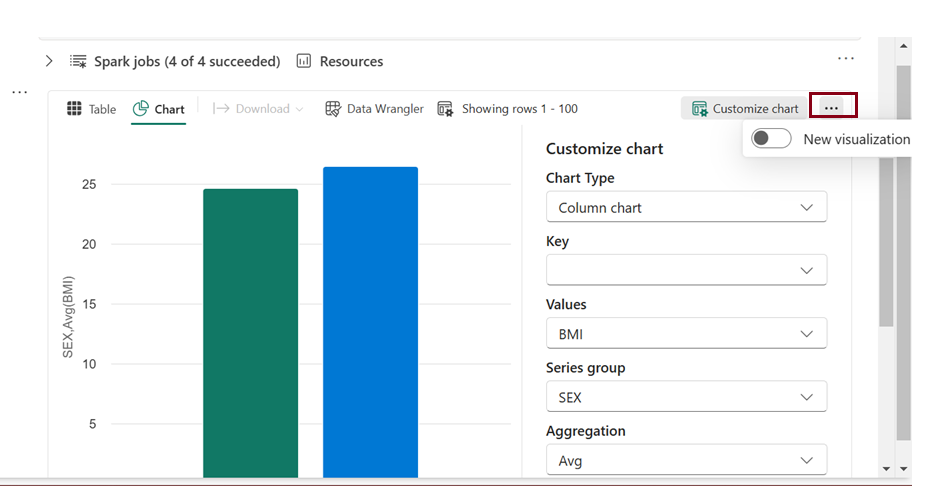
In the updated UI, we now have the option to create multiple charts on our own. Additionally, suggested charts are displayed on the right side, and we can choose to use them if desired. We have “Data wrangler” feature added directly on the ribbon newly when compared to previous interface.
Prepare the data using Data Wrangler
After ingesting and examining the data, you can perform data transformations. This can be achieved by running code in a notebook or leveraging the Data Wrangler tool, which can generate the necessary code for you.
- Choose “Data Wrangler” in the notebook ribbon to launch Data Wrangler.
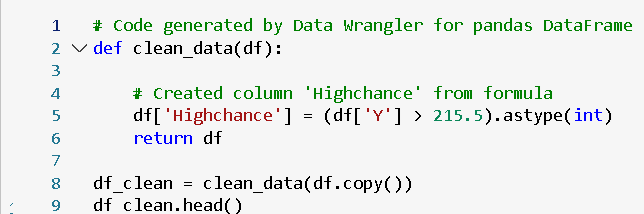
The label column, Y, is currently a continuous variable. While a regression model is suitable for predicting Y, interpreting its values can be challenging. Alternatively, training a classification model to predict low or high risk for diabetes is suggested. To do this, create a binary label column based on Y values.
- Navigate to the Operations panel, expand Formulas, and select Create column from formula.
Create a new column with the following settings:
- Column name: Highchance
- Column formula: (df[‘Y’] > 215.5).astype(int)
- Review the new Risk column added to the preview, ensuring the count of rows with value 1 is approximately 25% of all rows (representing the 75th percentile of Y).
- Select Apply.
- Choose Add code to notebook.
Train machine learning models
With the prepared data, you can now train a machine learning model for diabetes prediction. We’ll focus on training a classification model to predict the “Highchance” based on our dataset, as it involves categorizing individuals into low or high risk for developing diabetes. The training process utilizes the scikit-learn library, and MLflow is employed to track the models.
Train a Classification model
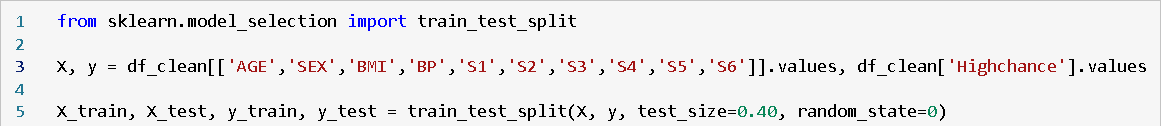
- Execute the provided code to divide the data into training and testing sets while separating the features from the target label “Highchance” that you aim to predict.
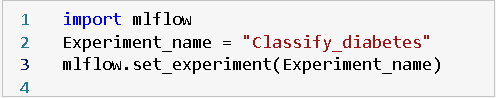
- Create a new code cell in the notebook, input the following code, and execute it. This code establishes an MLflow experiment titled “Classify_diabetes” where your models will be monitored and tracked.
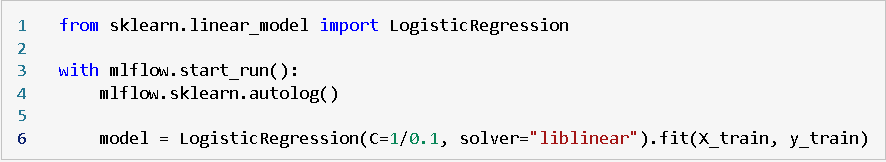
- Create a new code cell in the notebook, input the provided code, and execute it. This code utilizes Logistic Regression to train a classification model, automatically logging parameters, metrics, and artifacts with MLflow.
Explore your experiments
Microsoft Fabric will save and organize all your experiments, providing a user-friendly interface for visual exploration. There are two methods to explore your experiments in Microsoft Fabric: either
Through the workspace
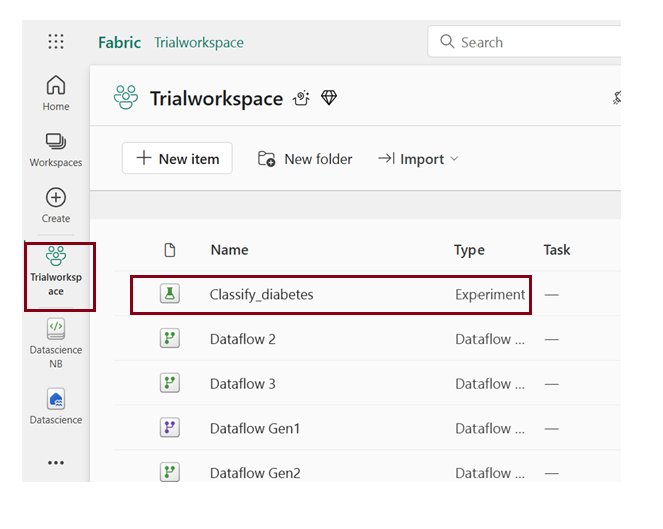
- Access your workspace through the left menu bar.
- Explore the “Classify_diabetes” experiment by opening it. In case you don’t find any runs, refresh the page.
Through the run name that was generated
- Explore the experiment by clicking on the created run name.
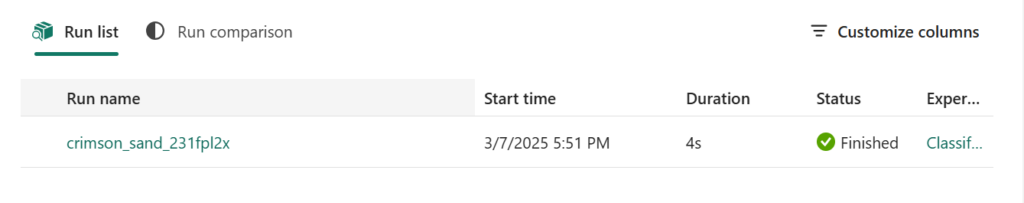
- Examine the metrics to assess the accuracy of the classification model.
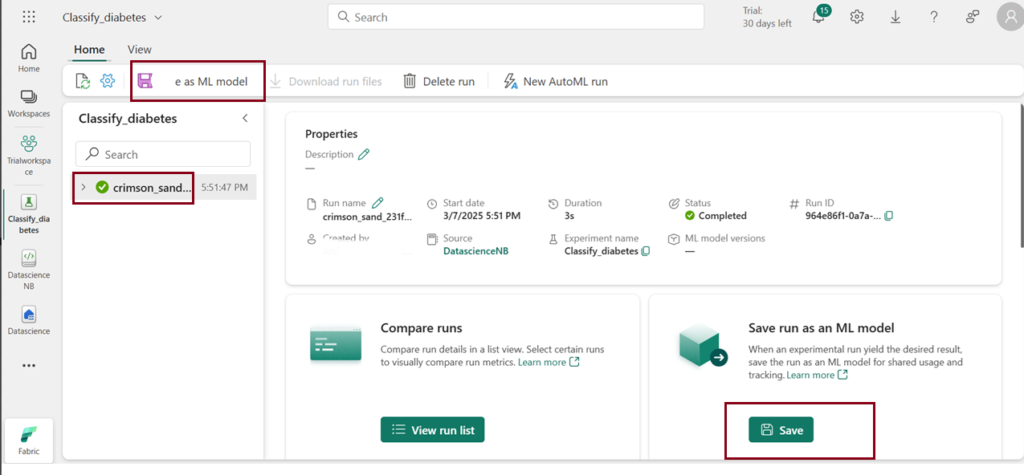
- Select Save as ML model in the menu bar or Click Save in the Save run as an ML model box.
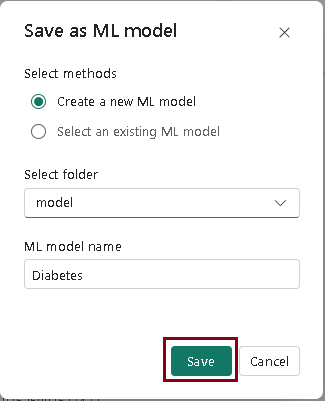
- In the “Save as model” window, pop-up, choose the option to “Create a new model.”
- Select the model folder.
- Enter the ML model name “Diabetes” and click Save.
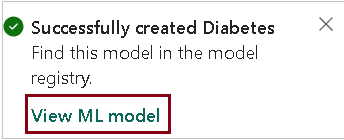
View model
- After the model gets saved, a notification will appear at the top right of your screen with the option to “View model.” Click on “View model” to access the saved model.
The saved model is linked to both the experiment and the specific experiment run, providing a comprehensive overview of how the model was trained.
| Tags | Microsoft Fabric |
| Useful links | |
| MS Learn Modules | |
Test Your Knowledge |
Quiz |