
Kusto Query Language (KQL) is the powerful query language behind Microsoft Fabric’s Real-Time Intelligence. Whether you’re diving into Eventhouse, monitoring with Log Analytics, or tracking app performance in Application Insights – KQL is your go-to language!
KQL is a powerful, yet simple-to-learn query language designed specifically for:
- Exploring and analyzing large volumes of data
- Discovering patterns and anomalies
- Performing aggregations and filtering
- Working with structured, semi-structured, and unstructured data
- Easy to read, write, and understand
It’s kind of like SQL but designed for the real-time world! If you’ve worked with SQL or scripting languages before, KQL will feel familiar. And even if you haven’t, the easily understandable syntax makes it beginner friendly.
Note: KQL is case-sensitive – table names, columns, and operators must match the exact casing.
How does a Kusto query work?
A Kusto query is a read-only request used to process and return data. It doesn’t modify any data — it just queries and returns results.
Kusto queries are made of query statements .There are three kinds of user query statements:
The most common type is the tabular expression statement. These work like data pipelines, where:
- You start with a table
- Apply filters, sorting, transformations, and aggregations
- Pipe data from one step to the next using the | symbol
Think of it like filtering water through layers of a funnel each operator further narrows or reshapes your dataset. Piping of information from one operator to another is sequential, the order of query operator is important, and can affect both results and performance. At the end of the funnel, you will get refined output.
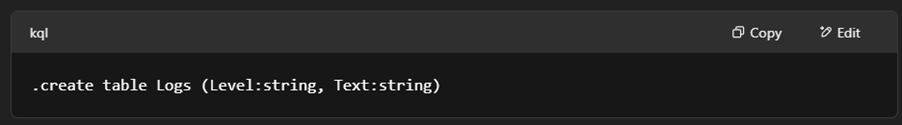
Management commands
While KQL is used to query data, there are also management commands that help you manage tables and metadata.
Source: Microsoft Learn
- These commands start with a dot (.), which distinguishes them from regular queries.
- Useful for managing schema, showing metadata, etc.
- E.g., .show tables lists all tables in your KQL database
To query real-time data using KQL, you first need to create an Eventstream and connect it to an Eventhouse. The Eventstream brings in the live data, and the Eventhouse stores it , that’s where you can run KQL queries on the real-time data.
Before diving into KQL lets refresh about Eventhouse and Eventstream.
Eventstream
Eventstream is a real-time data pipeline in Microsoft Fabric that lets you:
- Bring in data from live sources like Event Hub, IoT Hub, Kafka, or even sample data like Yellow Taxi.
- Apply visual transformations (like filters, joins, aggregations)
- Route the data to destinations like Lakehouse, Eventhouse, or custom apps
Check out Lesson 57 – Create and manage Event Streams with Microsoft Fabric for a full demo on setting up an Eventstream with Yellow Taxi data.
Eventhouse
Eventhouse is a real-time data storage solution inside Fabric that uses KQL databases. Think of it like a high-speed analytics engine, perfect for querying event data with blazing performance.
In our demo on previous lesson, we routed both original and transformed Yellow Taxi data into Eventhouse. Now we’ll use KQL to query and analyse that data.
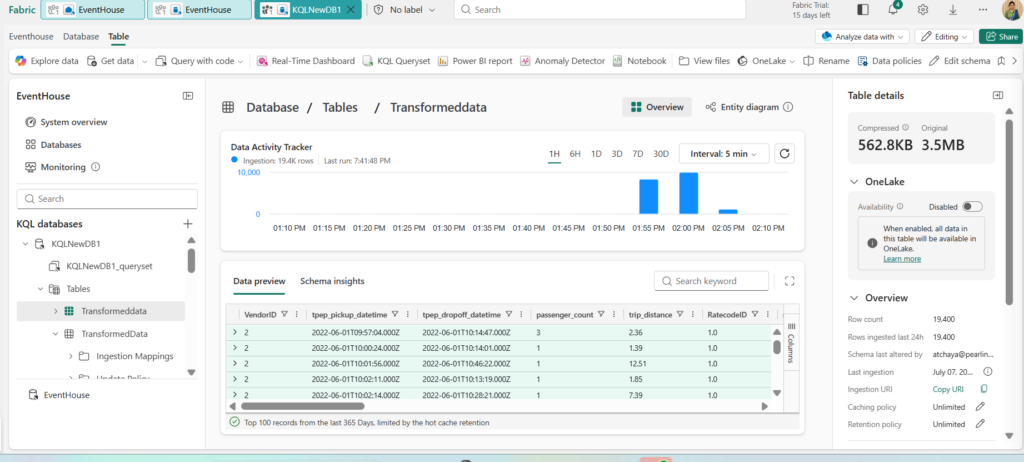
Above image shows data loaded into KQL database named “KQLNewDB1” and Eventhouse named “EventHouse”. Let’s query the Yellow Taxi data.
Exploring Yellow Taxi Data with KQL
1.View a few sample records – take operator
YellowTaxidata

| take 5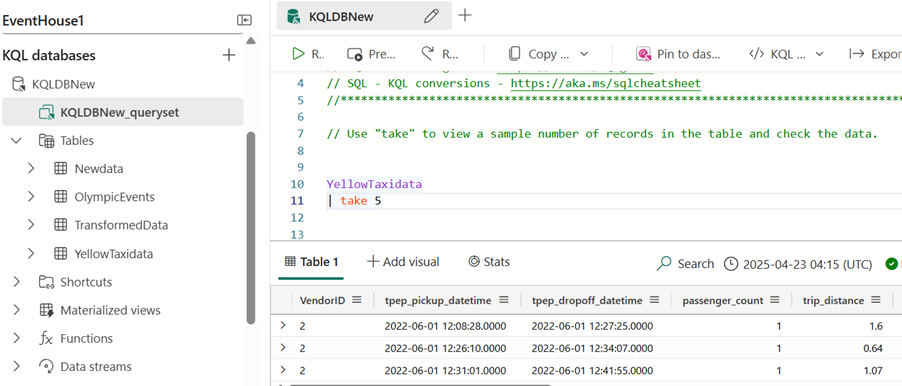
2. Select specific columns – project operator
YellowTaxidata

| project tpep_pickup_datetime, tpep_dropoff_datetime, passenger_count, trip_distance, payment_type, total_amount

| take 10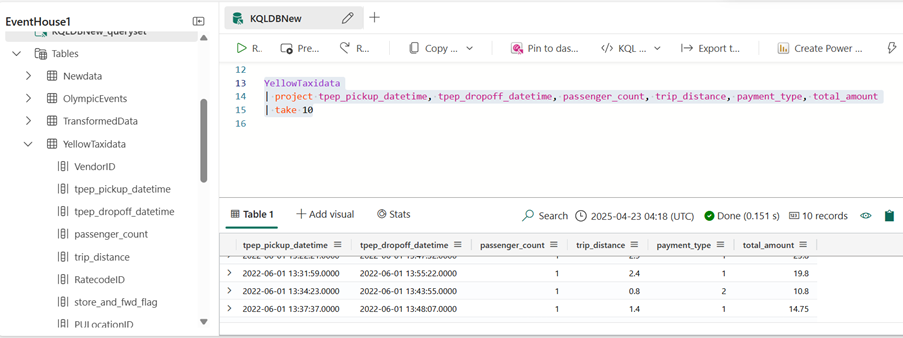
3. Filter rows – where operator
Trips with more than 3 passengers:
YellowTaxidata

| where passenger_count > 3

| project pickup_datetime, passenger_count, total_amount

| take 10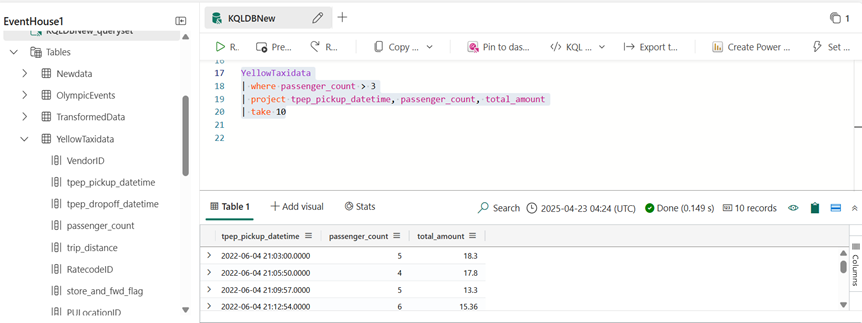
4.Rename the column
tip_amount column to tip
YellowTaxidata

| project-rename tip=tip_amount

| take 5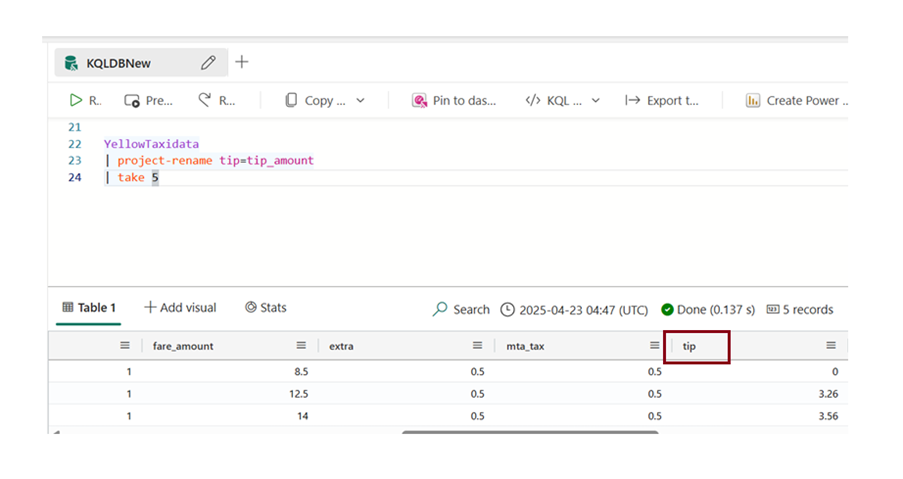
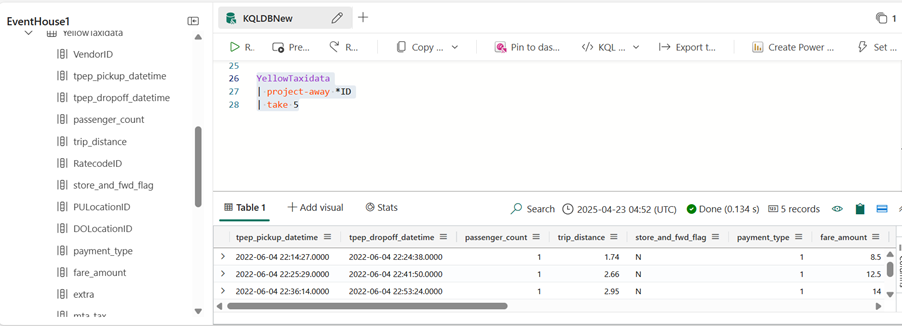
5.Excluding columns – Project away operator
To exclude certain columns from your query results, you can use the project-away operator. It lets you specify the columns you want to remove, while keeping everything else. You can even use wildcards — for example, | project-away *Id removes all columns that end with ‘Id’.”
YellowTaxidata

| project-away *ID
This will exclude columns like “VendorID,DOLocationID,PULOcationID” and Keep the remaining columns.
To check a column’s data type, just hover your mouse over the column name in the query editor. If the column is of type int (integer), you can use numeric operators to perform calculations like addition.
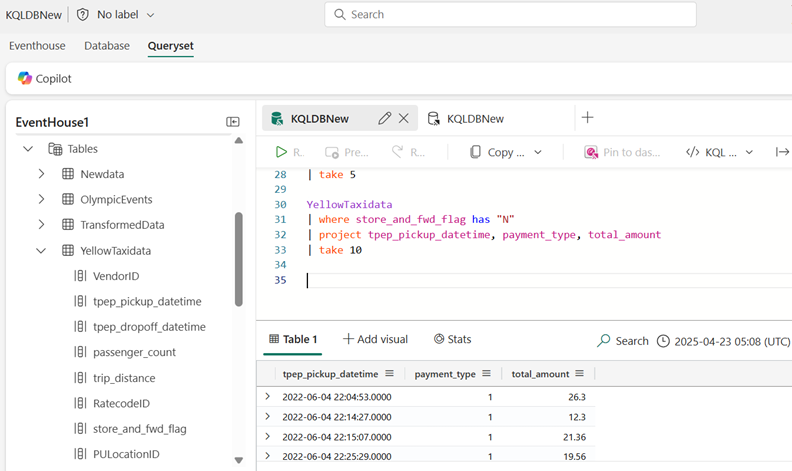
6.Filter with string match – has and contains
In the Yellow Taxi sample dataset, the store_and_fwd_flag column tells us whether the trip record was sent to the server in real time or stored and forwarded later.
YellowTaxidata

| where store_and_fwd_flag has "N"

| project tpep_pickup_datetime, payment_type, total_amount

| take 10
You can use “has” only for sting columns.
More flexible match using contains:
7. Using Sort Operator
YellowTaxidata

| where passenger_count > 3

| sort by fare_amount desc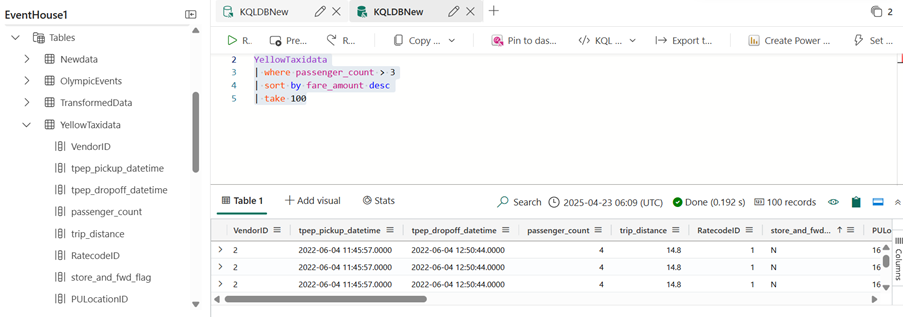
8. Aggregate: Average Fare by Passenger Count
YellowTaxidata

| summarize avg_fare = avg(fare_amount) by passenger_count

| sort by avg_fare desc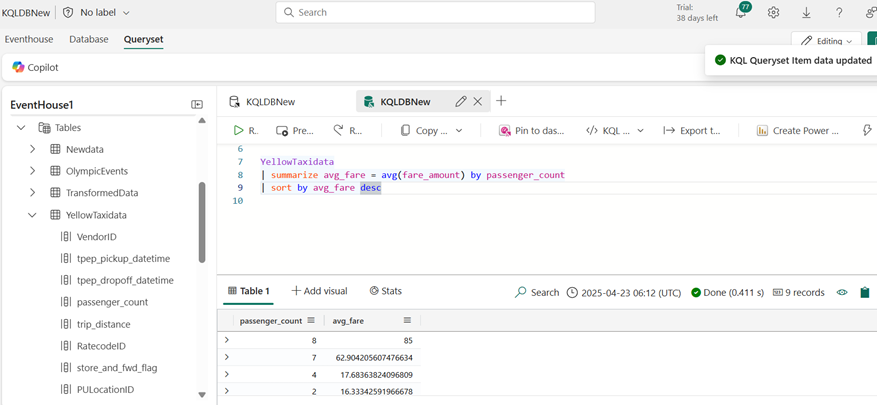
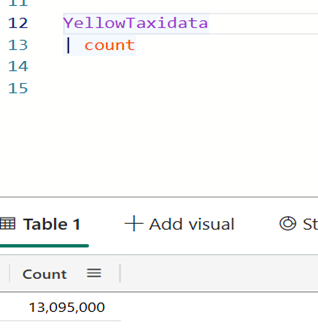
9.Count Total Records
YellowTaxidata
| count
KQL is your go-to tool for real-time analytics. And this is just the start, as we move forward, we’ll explore more advanced KQL features like joins, time-based aggregations, and visualizations.
Conclusion
Kusto Query Language (KQL) is a powerful yet beginner-friendly tool that helps you analyse real-time data. In this blog, we explored how to write basic KQL queries to filter, project, sort, and aggregate data from the Yellow Taxi dataset stored in Eventhouse.
With just a few lines of code, we were able to gain meaningful insights showing how simple, yet effective KQL can be for real-time intelligence scenarios in Microsoft Fabric.
The more you explore, the more powerful your real-time insights will become.
| Tags | Microsoft Fabric |
| Useful Links | |
| MS Learn Modules | |
Test Your Knowledge |
Quiz |