
In our previous blogs, we dove into the essentials of loading data into the warehouse using Microsoft Fabric. We covered different methods to bring your data into the warehouse efficiently.
Now, that your data is successfully loaded, the next critical step is ensuring your data warehouse runs optimally. Performance monitoring is key to maintaining high-speed query execution, minimizing bottlenecks, and managing resources effectively. Its very important to monitor and to track and manage costs ,identify the query performance issue and gain insights into how your data is being used.
Prerequisites
Before you begin monitoring, ensure you have the required permissions. Workspace Admins can view monitoring information for all users, while Members, Contributors, and Viewers can view only their own activity. To access Query Insights, you need the Contributor role or higher. You can also use the Monitor and Audit item-level permissions to grant monitoring access without assigning broader workspace roles.
Monitoring usage and activity is key to keeping your warehouse running smoothly.
Fabric offers tools to help you:
- Speed up query performance
- See when it’s time to scale your system up or down
- Track details about running and completed queries
Tools we use to monitor the performance of the queries are
- Microsoft Fabric Capacity Metrics app
- Query Activity
- Query Insights
- Dynamic Management Views (DMVs)
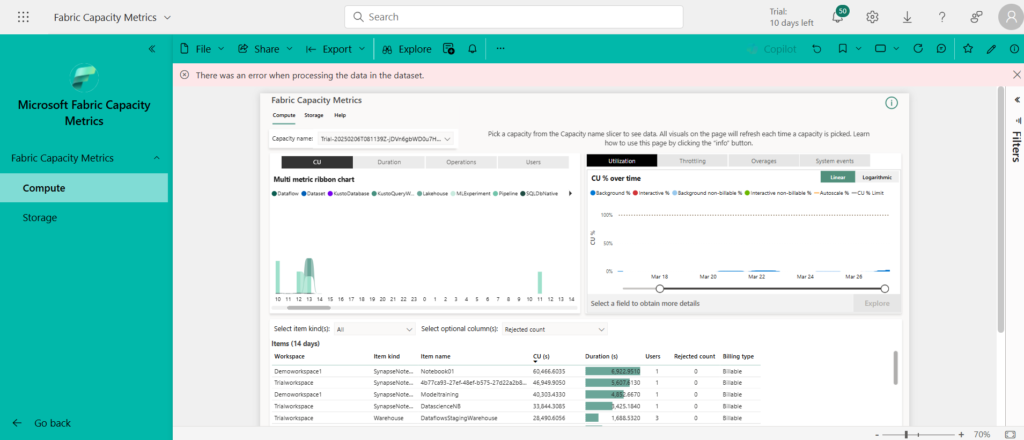
Microsoft Fabric Capacity Metrics app:
This app shows how much capacity each warehouse is using, including compute charges for both user and system generated queries. It helps track overall resource consumption in your warehouse.
The Microsoft Fabric Capacity Metrics app helps you monitor your capacity usage in Microsoft Fabric. It gives you insights into your consumption, helping you make decisions on when to scale up or enable autoscaling.
The app is regularly updated with new features and provides detailed information on how your capacities are performing.
How to install the Microsoft Fabric Capacity Metrics app for the first time:
- From AppSource:
- Go to AppSource, search for Microsoft Fabric Capacity Metrics, and click Get it now.
- In Fabric portal switch to power BI View
- Open Power BI and go to Apps.
- Click Get apps.
- Search for Microsoft Fabric and select the Microsoft Fabric Capacity Metrics app.
- Click Get it now.
- Sign in and Complete Registration:
- Sign in to AppSource with your Microsoft account.
- Follow the registration prompts, and the app will take you to Microsoft Fabric.
- Click Install to complete the process.
- Install the App:
- In the Install this Power BI app window, click Install.
- Wait a few seconds for the app to finish installing.
Once installed, you can start using the app to monitor your capacity usage.
Once you install the capacity metric app sign in with the capacity id ,below video shows how to get the capacity id to sign into capacity metric app.
Once you sign in with the capacity id you will be able to monitor the performance of your different workloads and capacity units they use.
Query Activity
Provides an easy-to-use interface to see the status of running and completed queries without needing to write T-SQL. It gives you a quick overview of query activity.
There are two ways you can launch the Query activity experience.
- Click on More Options (…) next to the warehouse you wish to monitor in the workspace view, then choose Monitor
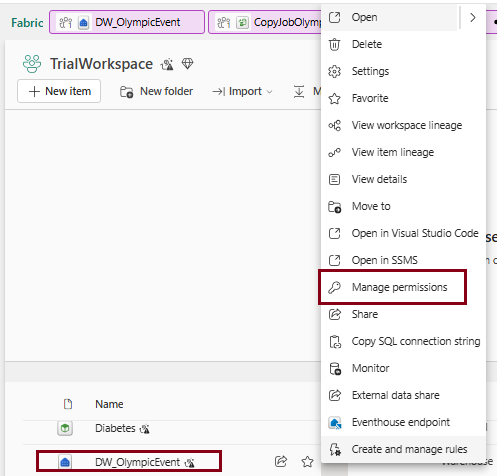
- In Monitor view, there we have options on the top ribbon “Long Running Queries”. We can choose that.
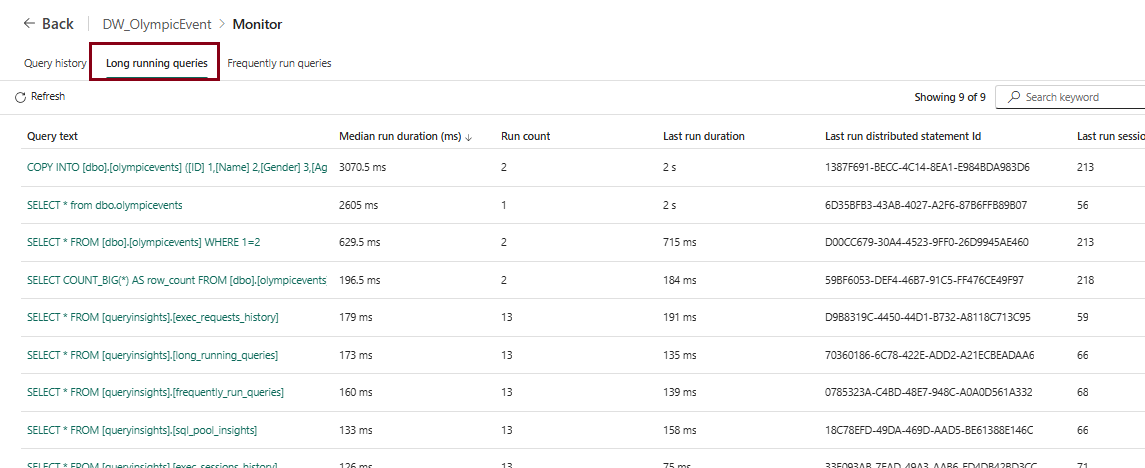
Here we have the query runs, long running and frequently running queries.
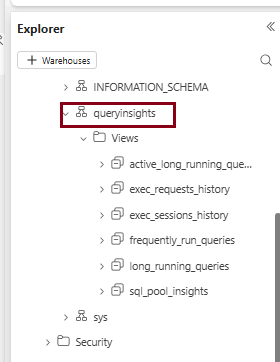
Query insights
The Query Insights feature tackles various important questions and issues related to query performance and database optimization, including:
Query Performance Analysis helps track historical query performance, identify long-running queries, and spot bottlenecks. It also checks cache utilization and CPU consumption.
Query Optimization and Tuning focuses on improving frequently run queries, identifying failed or cancelled queries, tracking performance changes, and addressing consistently poor-performing queries.
User Activity Monitoring tracks who submitted specific queries and identifies the most active users or those with the longest-running queries.
In short Query Insights is more about historical performance and optimization, while Query Activity is about current query monitoring.
Query Insights now also includes a Warehouse Insights view (sql_pool_insights) for pool-level metrics and resource-pressure indicators, giving overall warehouse health beyond individual queries
Dynamic management views (DMVs)
To monitor the current activities inside your data warehouse we have to use dynamic management views.
Three types of different dynamic management views
- sys.dm_exec_connections: Returns information about data warehouse connections.
- sys.dm_exec_sessions: Returns information about authenticated sessions.
- sys.dm_exec_requests: Returns information about active requests.
sys.dm_exec_connections:
- This view provides information about the connections to the data warehouse. It includes details like the client IP address, connection time, and other connection-related statistics. It helps monitor who is connecting to the system and the state of those connections.
(Admin-only: only users with the Admin workspace role, or item-level Monitor permission with admin scope, can run this specific DMV; other roles can’t query it at all.)
sys.dm_exec_sessions:
- This view returns information about authenticated sessions in the system. It includes details about the user session, such as session ID, login time, and status. This helps track active user sessions and manage resources effectively.
sys.dm_exec_requests:
- This view shows information about active requests that are currently running on the system. It provides details like the status of the query, start time, and any blocking requests. It helps monitor and troubleshoot queries that are running in real-time.
- Member, Contributor, and Viewer roles can run sys.dm_exec_sessions and sys.dm_exec_requests, but only see their own results — only Admin sees everyone’s.
Overall summary
- Microsoft Fabric Capacity Metrics app helps you monitor capacity usage and compute charges, enabling informed decisions on scaling resources.
- Query Activity provides a real-time overview of running and completed queries, allowing easy tracking of query performance.
- Query Insights offers historical data on query performance, helping identify bottlenecks and optimize frequently run queries.
- Dynamic Management Views (DMVs) give real-time information about active connections, sessions, and requests, aiding in troubleshooting and performance monitoring.
- Monitor and Audit item-level permissions let you grant query-history/DMV access or audit-log access to specific people without giving them a full workspace role
Conclusion
In conclusion, monitoring and optimizing the performance of your data warehouse in Microsoft Fabric is essential for ensuring efficiency and cost-effectiveness. Tools like the Microsoft Fabric Capacity Metrics app, Query Activity, Query Insights, and Dynamic Management Views (DMVs) provide valuable insights into capacity usage, query performance, and real-time system activity. By leveraging these tools, you can identify bottlenecks, improve query execution, and make informed decisions about scaling resources. Proper monitoring helps maintain a smooth, high-performing data warehouse environment
| Tags | Microsoft Fabric |
| Useful Links | |
| MS Learn Modules | |
Test Your Knowledge |
Quiz |